Understanding Ron360 Responses: Prose, Charts, and Tables
Understanding Ron360 Responses: Prose, Charts, and Tables
Ron360 can respond with plain-language explanations, charts, tables, or a combination of these. The response type depends on the question and the data needed to answer it.
Prose responses
A prose response is a written answer. Ron360 uses prose when the question is best answered with explanation, guidance, summarization, or next steps.
Common prose response examples:
Explaining what a metric means.
Summarizing the result of a data search.
Providing recommended next actions.
Answering how-to or knowledge-base questions.
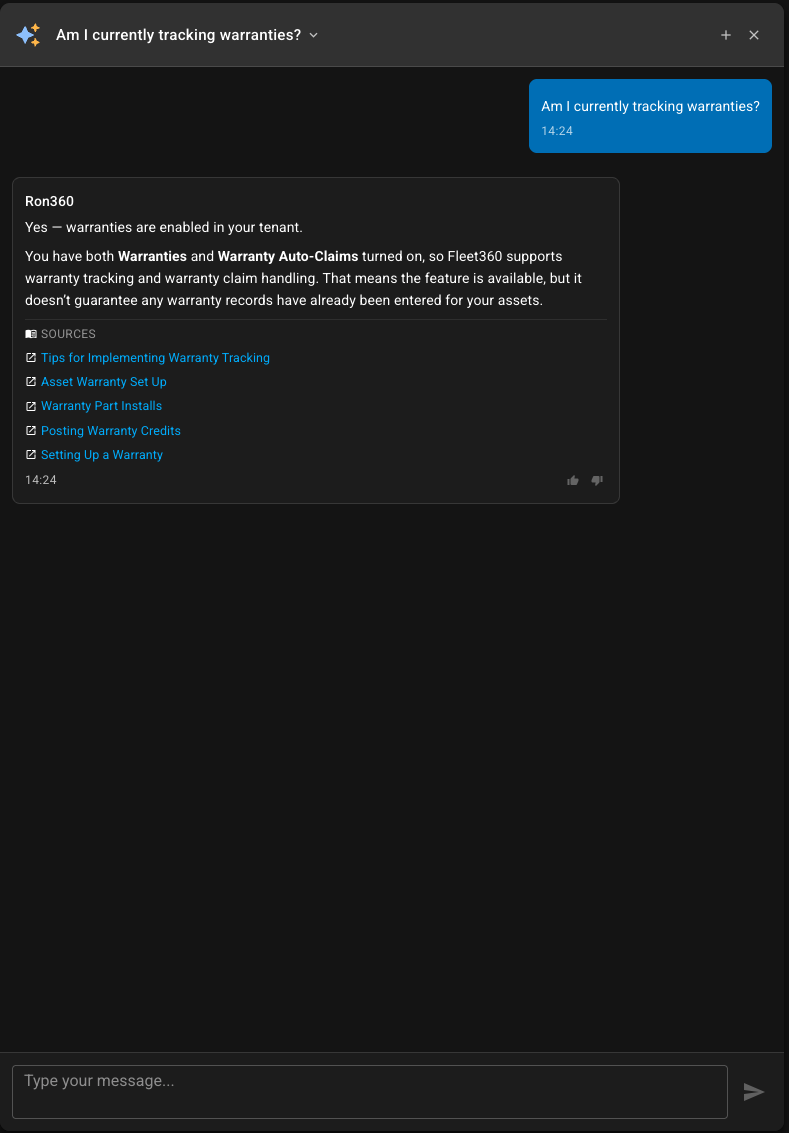
Chart responses
Ron360 uses charts when the answer is best understood visually, such as trends, comparisons, rankings, and distributions.
Chart use | Example question |
|---|---|
Trend over time | Show fuel consumption trend for the last 6 months |
Ranking | Which facilities have the most open work orders? |
Distribution | Show asset count by status |
Cost comparison | Show maintenance cost by facility this quarter |
Chart responses may include these actions:
Fullscreen — opens the chart in a larger view.
Save Widget — saves the chart to the company-wide AI widget library so it can be added to a custom dashboard.
If Ron360 cannot save a chart, it may mean the aggregation details needed to rebuild the chart are unavailable.
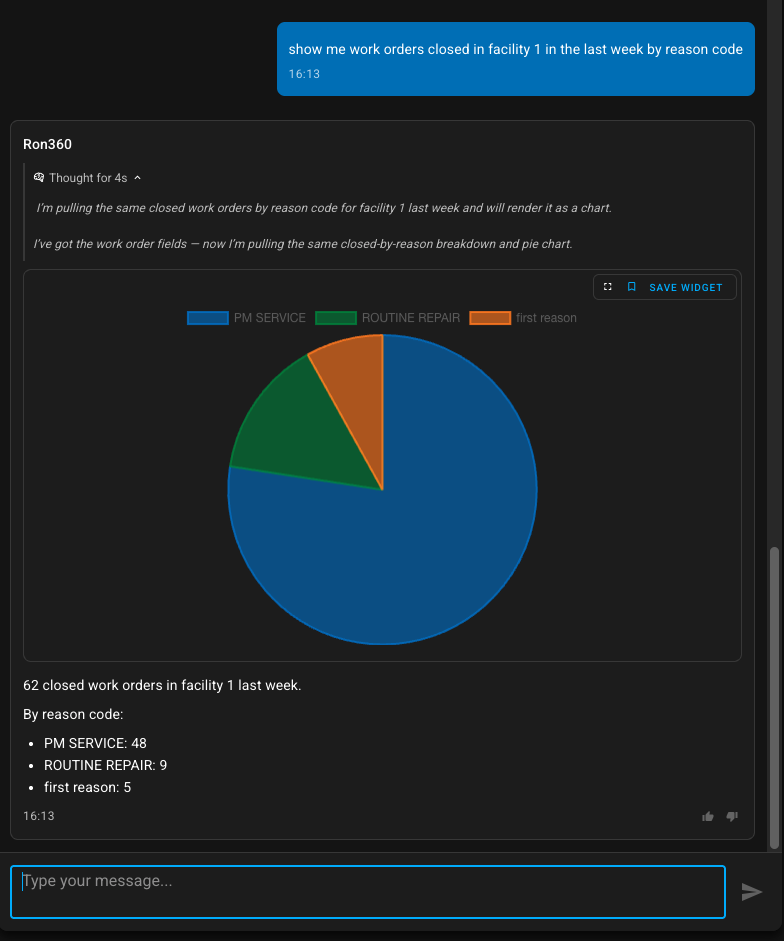
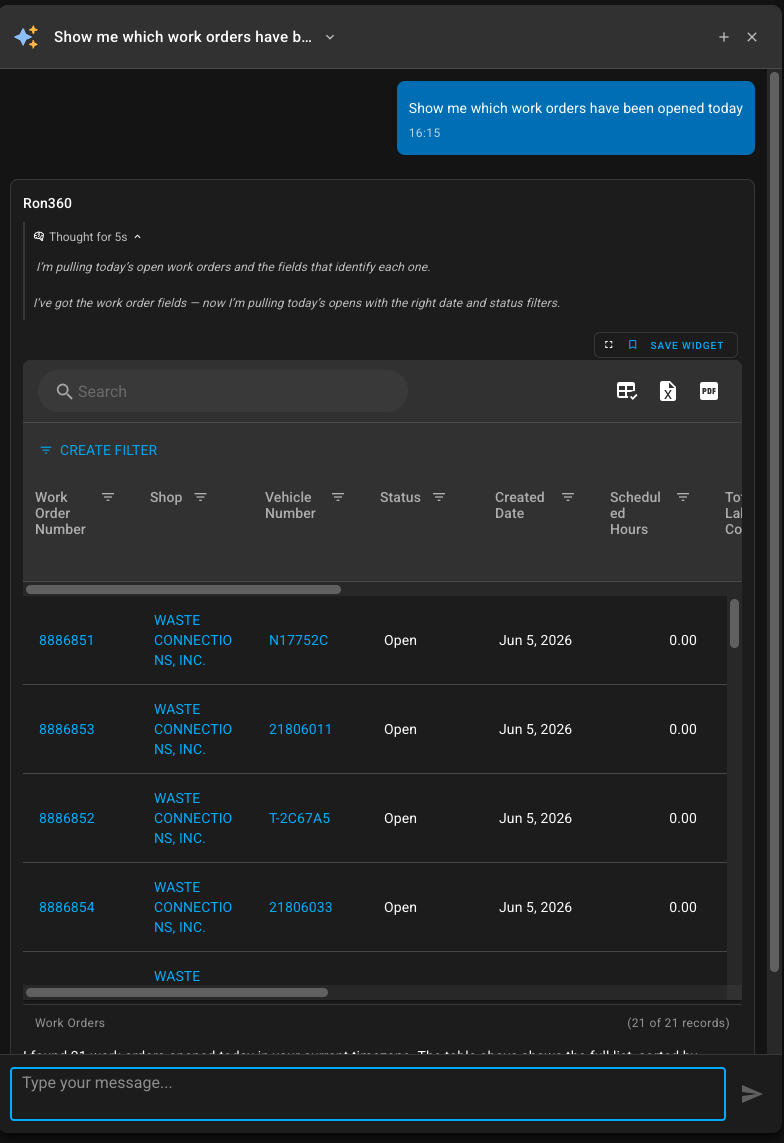
Table responses
Ron360 uses tables when the answer needs record-level details, columns, filtering, sorting, or export.
Table responses can include:
Clickable links to records when Fleet360 can route to the related item.
Filters and filter builder controls.
Search.
Spreadsheet and PDF export.
A record count showing how many records are displayed.
Fullscreen view for larger data review.
Save Widget when the table can be saved to the AI widget library.
Example table questions:
List open work orders by facility.
Show the top 25 parts by usage cost last month.
Which vehicles are due for service?
Show work orders completed this week by technician.
Source references
Some answers include source references. These appear when Ron360 answers using knowledge-base content. Click a source to open the referenced article or document.
Feedback
Use thumbs up or thumbs down on an AI response to provide feedback. When marking an answer negatively, add a short comment describing what was wrong or missing.
Notes
Ron360 may provide both a chart and a table when the question needs a visual summary and detailed records.
Ask follow-up questions to narrow the date range, add filters, change grouping, or switch between chart and table formats.