Work Order Line Totals by Cause Code
Summary/Use Case
Report Summary
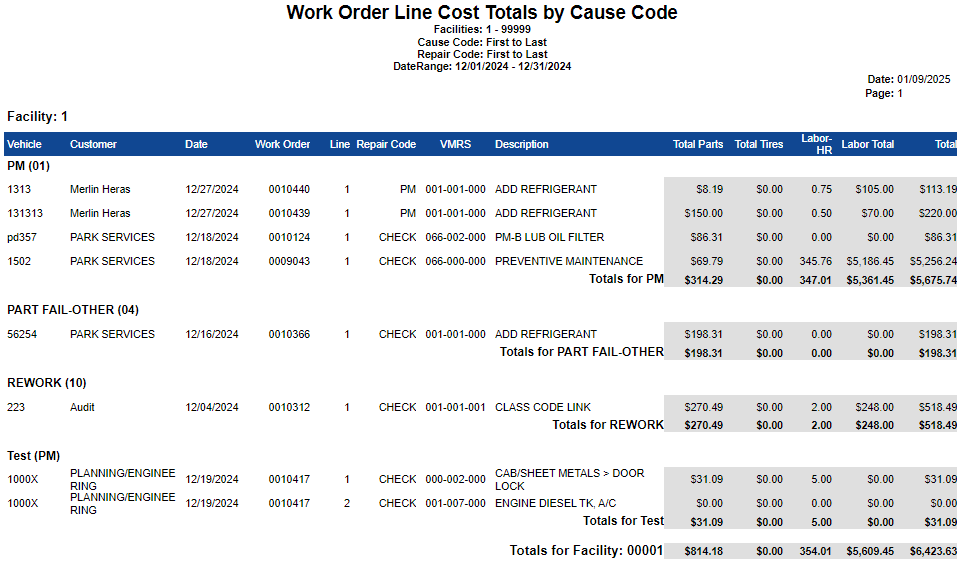
The Work Order Line Cost Totals by Cause Code report provides a detailed breakdown of costs associated with work orders, sorted by cause code. This report groups and summarizes costs at the facility level, including parts, labor, and total expenses per cause code. Fleet managers can use this report to monitor maintenance expenses, assess cost distribution across repair categories, and ensure proper budgeting.
Use Case
Analyze maintenance costs by cause code to identify areas of high spending
Review cost allocation for budgeting and financial planning
Track repair types and their associated costs for preventative maintenance strategies
Monitor labor and parts expenses for cost control and efficiency improvements
Ensure compliance with financial reporting standards by providing detailed breakdowns
Location: Where to Find It
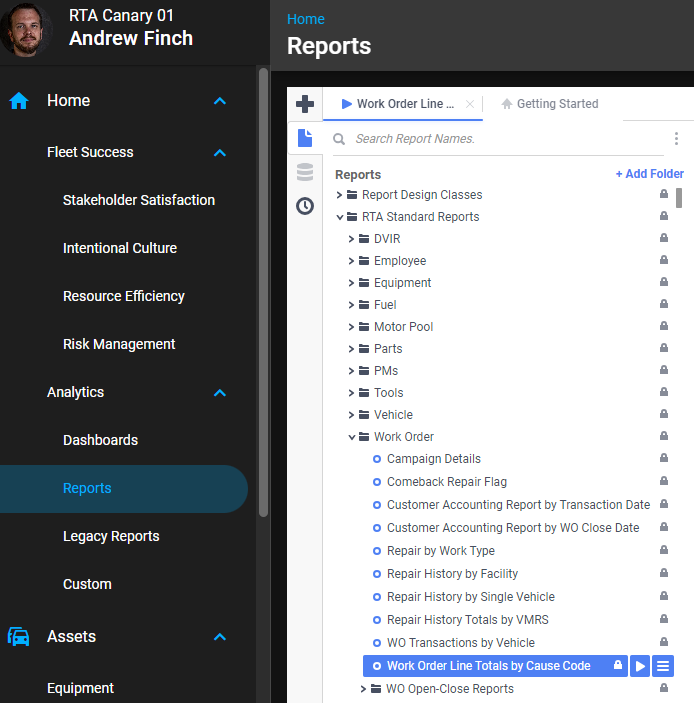
Reports > RTA Standard Reports > Work Order > Work Order Line Totals by Cause Code
Data Filter Prompts
You will be prompted for filtering of the Data to specify and narrow down the data that will be pulled. See Data Filter List Below for Options.
Data Filter List
Filter Name | Recommended Filter Condition(s) | Value (Options) | Value (Default) | Value (Notes) |
|---|---|---|---|---|
WO Facility | Is Between | 1 to 99999 | 1 to 99999 | Represents the full range of possible facility numbers |
Cause Code | Is Between | First to Last | Blank to zzzzzzzzzzzzzzzzzzz | blank represents the first and 'z' the last possible value |
Repair Code | Is Between | First to Last | Blank to zzzzz | blank represents the first and 'z' the last possible value |
WO Close Date | Is Between | Any date range | First - Last Days of the Previous Month | Date range can be customized for the reporting period |
Report Output and Data Elements
When the Work Order Line Cost Totals by Cause Code report is run, it displays a detailed summary of work order costs sorted by cause code. The data is grouped by facility and provides total costs for each category, including parts, labor, and totals for each section. The output helps in evaluating maintenance spending patterns.
Report Output
Report Data Elements
Column Number | Column Title | Data Notes |
|---|---|---|
1 | Vehicle | The vehicle associated with the work order |
2 | Customer | The customer associated with the work order |
3 | Date | Date when the work order was created |
4 | Work Order | Unique identifier for the work order |
5 | Line | Work order line-item number |
6 | Repair Code | Code representing the type of repair performed |
7 | VMRS | VMRS (Vehicle Maintenance Reporting Standards) coding |
8 | Description | Description of the work performed, or parts used |
9 | Total Parts | Total cost of parts used in the work order |
10 | Total Tires | Total cost of tires used in the work order |
11 | Labor-HR | Total labor hours worked |
12 | Labor Total | Total cost of labor performed |
13 | Total | Total cost of the work order, including parts and labor |


