Building a Report Using the Wizard
This article will walk users through the New Report wizard and demonstrate how to create a new report.
Click the Create a New Report button
 .
.There are several types of reports, the most common being an Advanced Report.
Note: This article will focus on building an Advanced Report. For information on the other types of reports, see Report Types.
The New Report wizard will come up. The New Report wizard has five sub tabs. The Name and Categories tabs must be completed while the other tabs are optional.
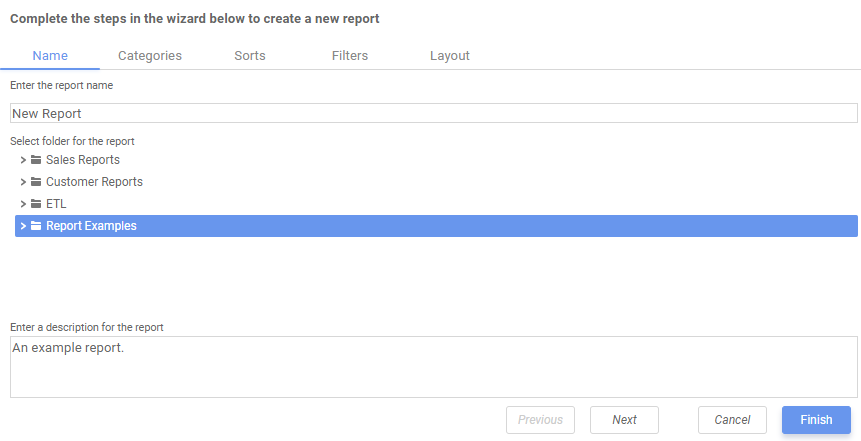
Name Tab
In the Name tab, enter a report name and click on the folder where the report will be saved.
The report name can be up to 255 characters long. The following special characters may not be used: ? : / \ * “ < >
The report’s description appears at the bottom of the Main Menu when it is selected. The description text may also be used to search for a report.
Note: You cannot create a report inside a folder that is read-only ( Lock Icon).
Categories Tab
In the Categories Tab, select the Data Categories that you would like to have access to on the report. It is important to understand two terms: Data Category and Data Field.
Data Category – A Data Category is a data object that has several attributes. For example, Students is a category; each student has an ID, a major, an advisor, etc.
Data Field – A Data Field is a single attribute within a category. For example, Students.ID is the numeric value that identifies a specific student.
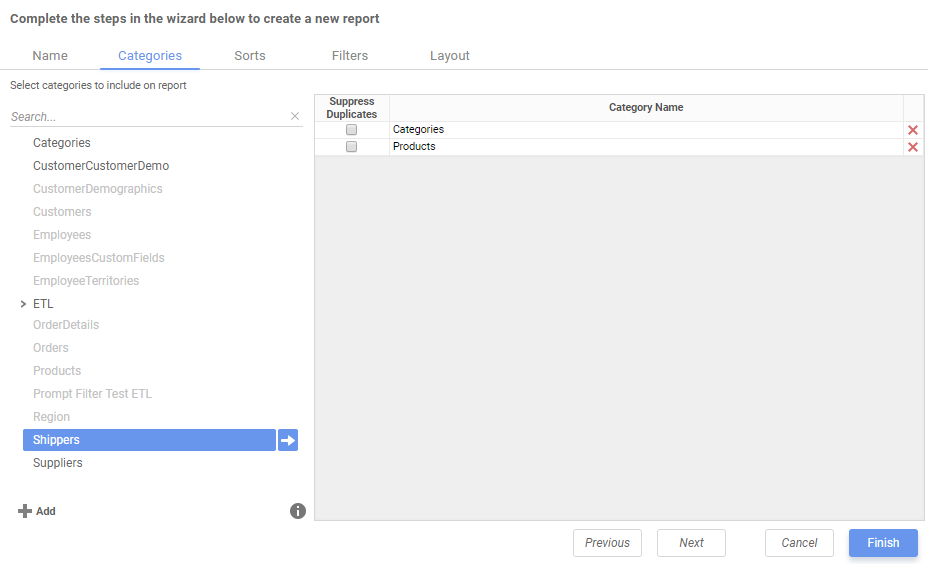
To add a Data Category, either drag and drop it to the Category Name column, use the
Add button, or double-click the category.
Note: When one Data Category is added, other Data Categories that are not joined to it become unavailable by default.
To search for a specific Data Category or folder, type its name into the Search box.
To see what Data Fields are in a Data Category, click on a Data Category and then click the information button.
Check the Suppress Duplicates box to suppress any repeated records from that category.
To remove a Data Category, click the delete ❌ button.
For this report, we've selected Categories and Products.
Note: For each category selected, a user can Suppress Duplicates within the data by ticking the check box that appears next to the category name. This will suppress repeated items in the given category for the final report.
Sorts Tab
In the Sorts tab, specify which Data Fields will be used to determine the order of data on the report.
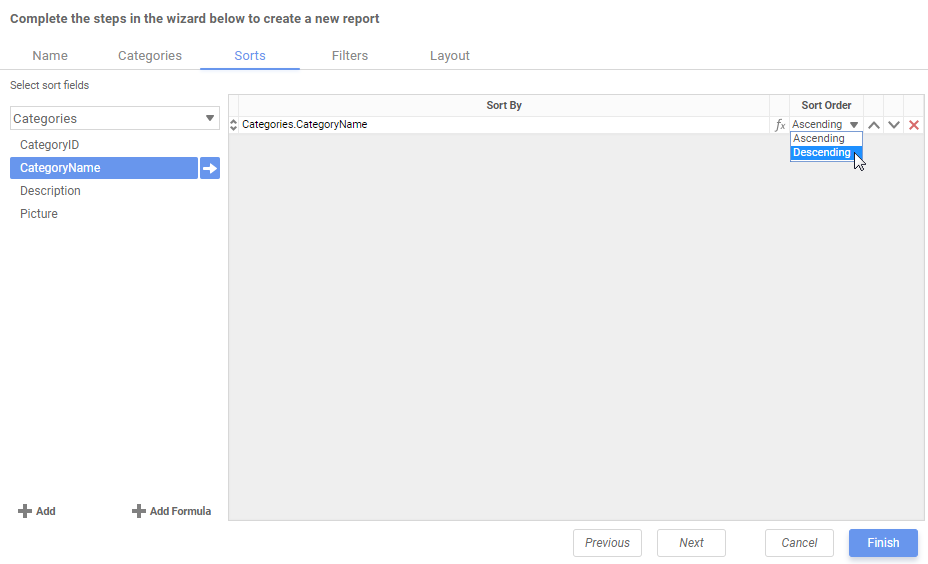
To sort by a Data Field either drag and drop it to the ‘Sort By’ Column, use the Add button
, or double-click the field.You can sort each Data Field in Ascending (A-Z, 0-9) or Descending (Z-A, 9-0) order.
Use the up 🔼 and down 🔽 arrows to indicate the sort priority.
To remove a sort, click the delete button ❌.
For this report we have Sorted on Categories.CategoryName in descending order.
Note: Sorts are not mandatory in order to create a report. Sorts allow for more complex organization of a report but do not bar the report wizard from continuing if left blank.
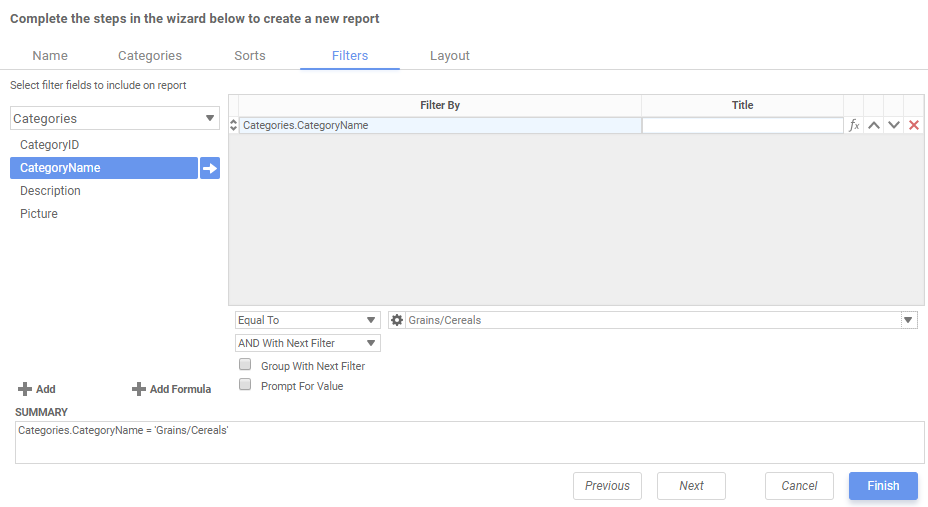
Filters Tab
In the Filters tab, create statements that will be used to filter the data when you run a report.
There is no limit to the number of filters that can be defined. Filters can be numeric (up to eight decimal places) or alphanumeric.
To filter a Data Field, either drag and drop it to the ‘Filter By’ column, use the button or double-click it.
Use the up 🔼 and down 🔽 arrows to indicate the filter priority.
To remove a filter, click the delete button ❌ .
Set the operator (equal to, less than, one of, etc.) by selecting it from the operator drop-down.
Set the filter value by either entering it manually or selecting a value from the drop-down. If the Data Field is a date, the calendar and function buttons can be used to select a value.
Select ‘AND With Next Filter’ to require that the selected filter and the one below it both evaluate to true. Choose ‘OR With Next Filter’ to require that either be true.
Check ‘Group With Next Filter’ to of the filters. Filters can be nested indefinitely by using the following keyboard shortcuts while a filter is selected:
Ctrl + [ adds an open-parenthesis before the selected filter.
Ctrl + ] adds a close-parenthesis after the selected filter.
Ctrl + Shift + [ removes an open-parenthesis from before the selected filter.
Ctrl + Shift + ] removes a close-parenthesis from after the selected filter.
Check ‘Prompt for Value’ to allow the filter to be modified at the time the report is executed.
For this report, an Equal To filter on Category Name has been created in order to limit the data on the final report.
Note: Like Sorts, Filters add complexity to a report but, but their completion is not mandatory.
Important: If a filter is chosen, the above fields must be completed or the report will not execute.
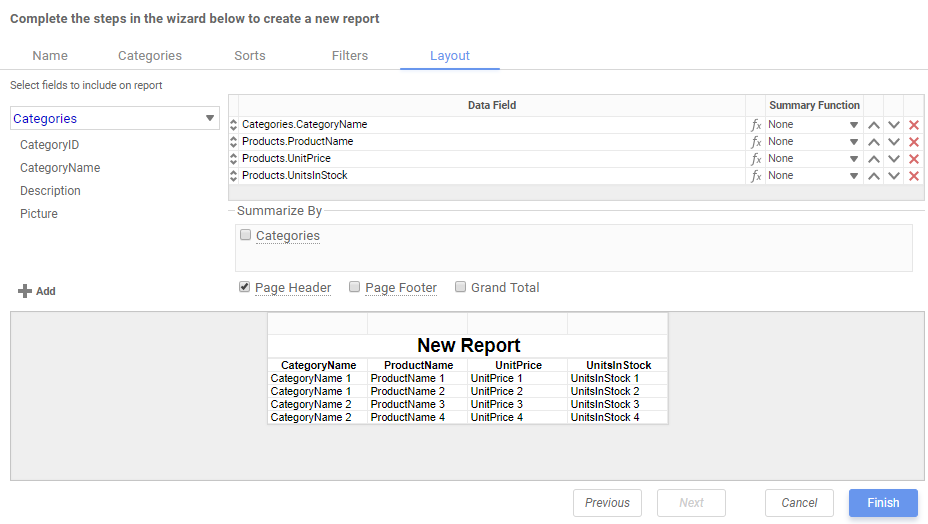
The Layout Tab
In the Layout tab, select the Data Fields that will appear on the report. For each Data Field chosen, the report will automatically create a column header and place the Data Field in the detail section. Additionally, subtotals, grand totals, and a page header/footer can be created.
Display Data
To place a Data Field on the report, either drag and drop it to the ‘Data Field’ column, use the Add
button, or double-click the field.
Use the up 🔼 and down 🔽 arrows to indicate the order the Data Fields should appear on the report. The Data Field at the top will appear on the report as the left-most column.
The Summary Function column is used to make subtotals and grand totals. See Subtotals and Grand Totals below for more information.
To remove a Data Field, click the delete button ❌.
Using the ‘Summarize By’ box, you can display subtotals, grand totals, or headers for the values of a Data Field.
Subtotals and Grand Totals
To display subtotals, check the box of the category you want subtotals for in the Summarize By box. Then, for each Data Field you want totaled, select a Summary Function (see below).
To display grand totals, check the Grand Total box. Then for each Data Field you want totaled, select a Summary Function (see below).
Summary Functions:
Sum: Totals the all of the data in the Data Field.
Count: Returns the number of rows in the Data Field.
Average: Takes the mean of the data in the Data Field.
Minimum: Displays the lowest value in the Data Field.
Maximum: Displays the highest value in the Data Field.
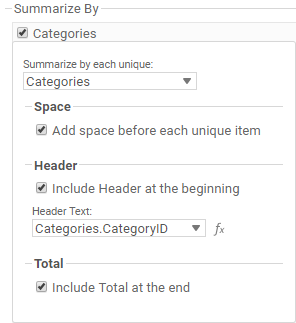
Data Headers
A checkbox will appear in the Summarize By box for each Data Category in the Sorts tab. To display a header for each value of a Data Field, click on the associated Data Category in the Summarize By box. Click the Data Category name next to the checkbox, and the will appear.
To include a Header, check the box ‘Include Header at the beginning’. In order to select the text that will appear as the header value, use the Header dropdown to select a Data Field or use the Formula Editor Button (fx) to create a formula.
Use the ‘Summarize by each unique’ dropdown to specify if the header should repeat based on a specific field or fields within a Category.
Check the box ‘Include Total at the end’ to have a subtotal created for this Category.
For this report, the Data Fields Products.ProductName, Products.ProductID, Products.UnitPrice, and Products.QuantityPerUnit have been selected.
To see the report in the Report Designer, click Finish.
The Report Designer will display the report like this.
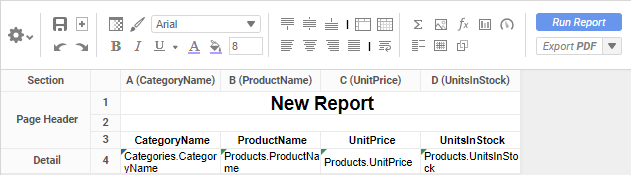
Note: For information on the Toolbar and all its features, see Using the Toolbar.
Executing the report to one of the 5 export types is as simple as selecting it from the drop down located in the top right of the designer, or executing it from the main menu.
To add the next layer of intricacy to your articles you'll want to create grouping within the present data. To read more, continue to this article.