PM Cost Class Breakdown
Summary/Use Case
Report Summary
PM Cost Class Breakdown summarizes work order parts cost, labor cost, and hours by Class for a selected facility and date range, separating results into PM vs Corrective activity. Fleet managers use this report to understand where preventive maintenance dollars/hours are being spent versus corrective repairs, helping target cost control and maintenance strategy by class groupings.
Use Case
Compare PM vs Corrective spend and labor hours by class to spot where reactive work is dominating
Identify classes with unusually high corrective costs/hours to prioritize reliability initiatives or PM program changes
Track maintenance cost distribution across classes for budgeting, internal chargeback, or cost allocation reviews
Validate whether PM activity is occurring as expected (e.g., low PM costs/hours may indicate missed PM work)
Support management reporting by showing each class’s share of total costs/hours and PM percentage
Location: Where to Find It
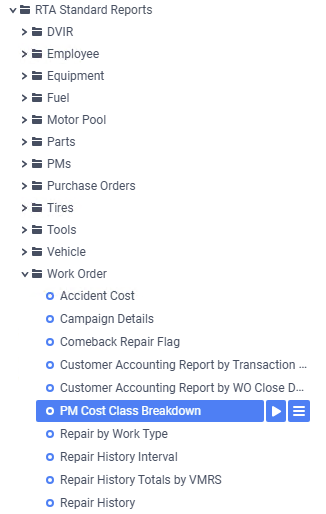
Reports > RTA Standard Reports > Work Order > PM Cost Class Breakdown
Data Filter Prompts
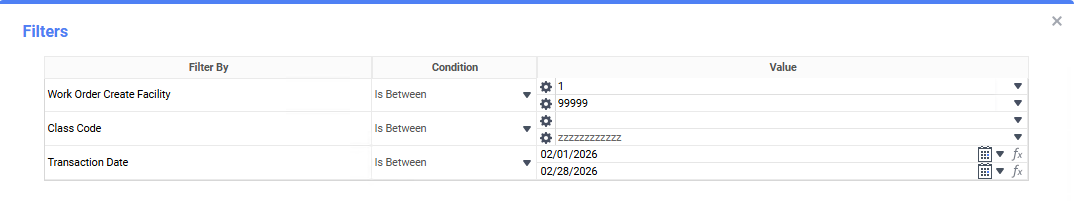
You will be prompted for filtering of the Data to specify and narrow down the data that will be pulled. See Data Filter List Below for Options
Data Filter List
Filter Name | Recommended Filter Condition(s) | Value (Options) | Value (Default) | Value (Notes) |
|---|---|---|---|---|
Work Order Create Facility | Is Between | Low: 1 | High: 99999 | Low: 1 | High: 99999 | Uses a numeric facility range. |
Class Code | Is Between | Low: blank | High: zzzzzzzzzzzzz | Low: blank | High: zzzzzzzzzzzzz | blank to “z…” represents the first and last possible values for this field filter (i.e., includes all class codes). |
Transaction Date | Is Between | Start Date | End Date | First to Last Date of the Previous Month | Default reflects the full month of February 2026. |
Report Output and Data Elements
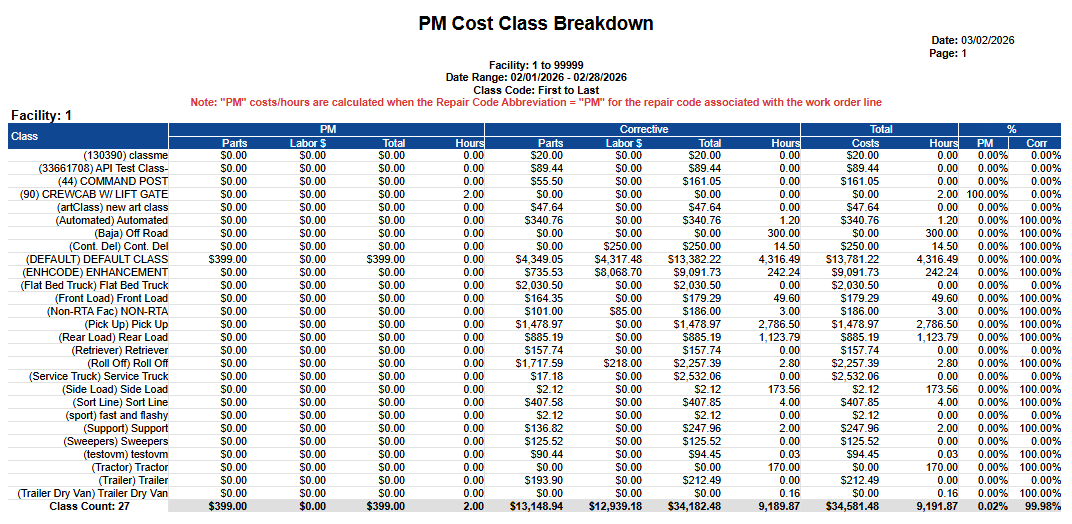
PM Cost Class Breakdown outputs a class-level summary table showing Parts, Labor $, Total, and Hours for both PM and Corrective work, plus overall Total Costs/Hours and the PM % and Corr % shares. The report includes a header summary (Facility, Date Range, Class Code selection) and ends with a Class Count total line; the cost and hour columns are effectively totaled across the displayed classes.
Report Output
Report Data Elements
Column Number | Column Title | Data Notes |
|---|---|---|
1 | Class | Class code/name grouping used to summarize work order activity |
2 | PM Parts | Total parts cost associated with PM repair codes; includes inside parts, outside parts, and tires minus warranty tires and parts |
3 | PM Labor $ | Total labor dollars associated with PM repair codes; includes inside and outside labor |
4 | PM Total | PM Parts + PM Labor $ + Misc $ |
5 | PM Hours | Total labor hours associated with PM repair codes; includes inside and outside labor |
6 | Corrective Parts | Total parts cost associated with corrective (non-PM) work; includes inside parts, outside parts, and tires minus warranty tires and parts |
7 | Corrective Labor $ | Total labor dollars associated with corrective work; includes inside and outside labor |
8 | Corrective Total | Corrective Parts + Corrective Labor $ + Misc $ |
9 | Corrective Hours | Total labor hours associated with corrective work; includes inside and outside labor |
10 | Total Costs | PM Total + Corrective Total for the class |
11 | Total Hours | PM Hours + Corrective Hours for the class |
12 | PM % | PM share of total (as a percentage) for the class |
13 | Corr % | Corrective share of total (as a percentage) for the class |
Report logic note (from report header): “PM” costs/hours are calculated when the Repair Code Abbreviation = “PM” for the repair code associated with the work order line.