Availability by Customer and Class
Summary/Use Case
Report Summary
The Availability by Customer and Class Report provides a detailed breakdown of vehicle availability, sorted by facility, customer, vehicle class, and specific vehicle details. This report helps fleet managers understand availability and usage patterns across different customer groups and vehicle classifications, which is crucial for optimizing fleet allocations and addressing specific customer needs.
Use Case
Track vehicle availability for specific customers and vehicle classes over time
Identify underutilized vehicles within specific classes or customer groups
Evaluate availability patterns to support fleet expansion or reduction decisions
Assess how different vehicle classes are performing in terms of availability and downtime
Support internal audits by providing a detailed view of fleet usage segmented by customer and class
Location: Where to Find It
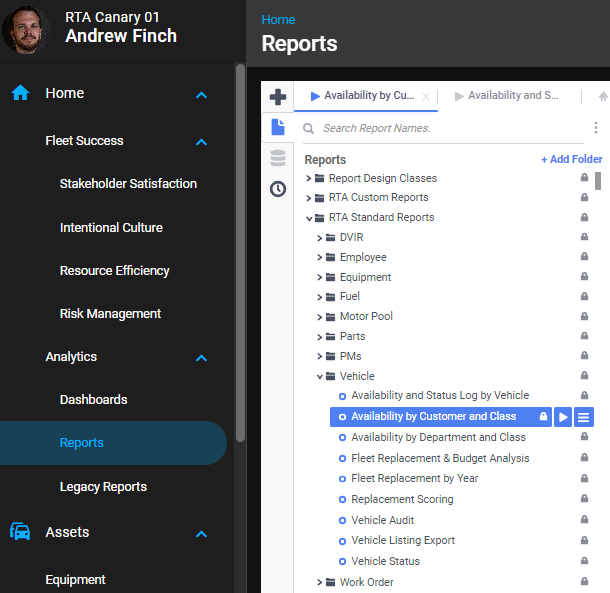
Reports > RTA Standard Reports > Vehicle > Availability by Customer and Class
Data Filter Prompts
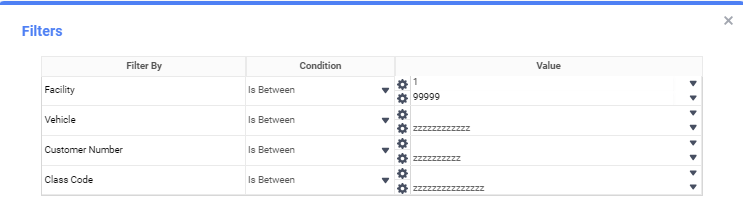
You will be prompted for filtering of the Data to specify and narrow down the data that will be pulled. See Data Filter List Below for Options.
Parameter List

Parameter Name | Value (Default) |
|---|---|
Please enter an availability start date | Defaulted to start of the previous month |
Please enter an availability end date | Defaulted to end of the previous month |
Data Filter List
Filter Name | Recommended Filter Condition(s) | Value (Options) | Value (Default) |
|---|---|---|---|
Facility | Is Between | 1 - 99999 | 1 - 99999 |
Vehicle | Is Between | blank - zzzzzzzzzzz | blank - zzzzzzzzzzz |
Customer Number | Is Between | blank - zzzzzzzzzzz | blank - zzzzzzzzzzz |
Class Code | Is Between | blank - zzzzzzzzzzz | blank - zzzzzzzzzzz |
Report Output and Data Elements
Report Output
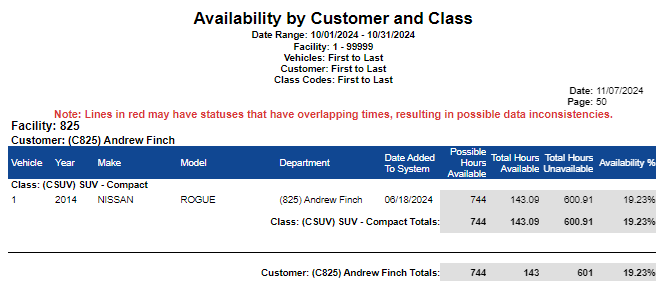
The Availability by Customer and Class Report provides a comprehensive view of vehicle availability categorized by facility, customer, vehicle class, and specific vehicles. The report includes details such as vehicle ID, model, department, first status start date, and availability percentage. The output highlights both total possible and unavailable hours for each vehicle and aggregates these metrics by customer, allowing for targeted analysis of fleet utilization by customer and vehicle class.
Report Data Elements
About First Status Start Date. Availability is calculated from the vehicle’s status history. The First Status Start Date column shows when that history begins — the start of the first status record on the vehicle — so a vehicle that has been on file for years but only started tracking status recently shows the more recent date. This is expected; it does not mean the report dates are wrong. To review the underlying status changes, run Availability and Status Log by Vehicle.
Column Number | Column Title | Data Notes |
|---|---|---|
1a | Facility | The facility to which the vehicle is assigned |
1b | Customer | The customer or group that the vehicle is associated with |
1c | Vehicle ID | Unique identifier for the vehicle |
1d | Class | Class code and description to which the vehicle is assigned to |
2 | Year | Manufacture year of the vehicle |
3 | Make | Vehicle manufacturer |
4 | Model | Model of the vehicle |
5 | Department | Department associated with the vehicle |
6 | First Status Start Date | The start date of the earliest status record Fleet360 has for the vehicle — the point from which availability is tracked. This is not the date the vehicle record was created, and not the Purchase Date, In-Service Date or first work order date. Older printouts label this column Date Added to System. |
7 | Possible Hours Available | Total possible hours within the date range |
8 | Total Hours Available | Hours the vehicle was available |
9 | Total Hours Unavailable | Hours the vehicle was unavailable |
10 | Availability % | Percentage of total hours the vehicle was available |