Replacement Scoring
For an explanation of how points are calculated for the Fleet360 Replacement Scoring Report, please see the Fleet360 Replacement Scoring guide
Summary/Use Case
Report Summary
The Replacement Scoring report provides a detailed breakdown of vehicle replacement scoring across a fleet. The report includes key replacement related data such as points, year, life meter, purchase price, maintenance cost, and condition, organized by facility and vehicle. Fleet managers can use this report to assess the replacement needs and overall condition of vehicles, enabling informed decision-making on vehicle replacements.
Use Case
Identify vehicles that need replacement based on scoring and condition thresholds
Prioritize vehicle replacements to optimize maintenance costs and reduce downtime
Monitor high-maintenance vehicles for budgeting and cost management
Support lifecycle management decisions by assessing vehicle age and usage metrics
Plan for long-term fleet replacement and budget allocation
Location: Where to Find It
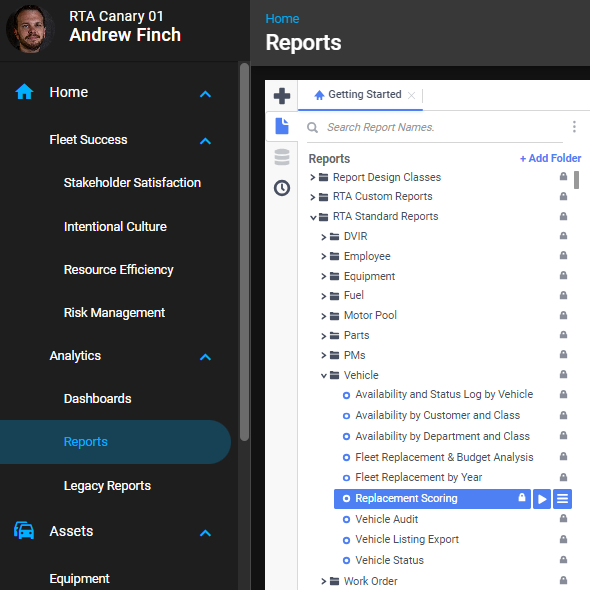
Reports > RTA Standard Reports > Vehicle > Replacement Scoring
Data Filter Prompts
You will be prompted for filtering of the Data to specify and narrow down the data that will be pulled. See Data Filter List Below for Options.
Data Filter List

Filter Name | Recommended Filter Condition(s) | Value (Options) | Value (Default) |
|---|---|---|---|
Facility | Equal To | 1 - 99999 | 1 |
Vehicle | Is Between | blank - zzzzzzzz | blank - zzzzzzzz |
Report Output and Data Elements
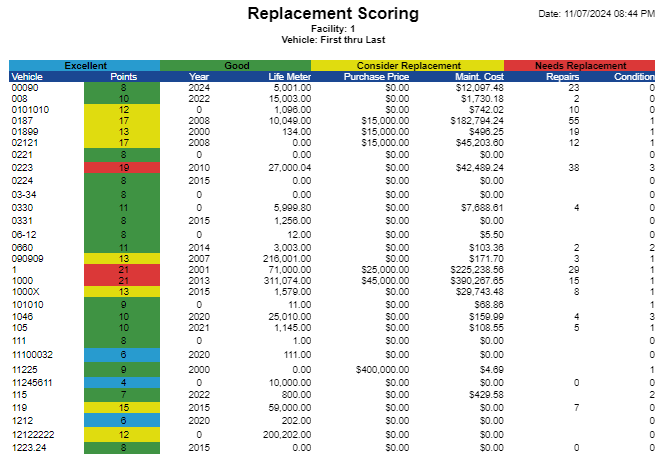
The Replacement Scoring Report provides a visual and tabular breakdown of vehicle conditions, categorized from "Excellent" to "Needs Replacement" based on the scoring metrics. This report allows users to view the vehicle details and replacement prioritization across the fleet at a glance. Key highlights include categorization by vehicle condition, point scoring, and life meter values. See below for explanation of points calculations.
Report Output
Report Data Elements
Column Number | Column Title | Data Notes |
|---|---|---|
1 | Vehicle | Identifier for each vehicle within the fleet |
2 | Points | Replacement score based on the vehicle's age, usage, and condition metrics |
3 | Year | Model year of the vehicle |
4 | Life Meter | Usage metric, such as mileage or hours |
5 | Purchase Price | Original purchase price of the vehicle |
6 | Maintenance Cost | Total cost of maintenance over the vehicle's lifetime |
7 | Repairs | Total number of repairs conducted on the vehicle since the start of the previous year |
8 | Condition | Overall condition classification on a scale of 0 - 5 |
Repair Cost and Repairs do not cover the same window - differences from asset history are expected. Repair Cost is the asset’s lifetime maintenance cost, while Repairs counts only the work orders (or job lines) opened within the last year - the asset’s yearly service count. So Repairs will always be lower than the asset’s full service history, and the two columns are not expected to match each other or the history screens. Whether one “repair” counts a work order or a job line is set by the asset class’s Service Count method (Class > Replacement).