Fleet360 Replacement Scoring
Introduction
This guide is designed to help you understand and use Fleet360’s Replacement Scoring, which evaluates the condition of your assets across five key categories:
Percentages to Points
Points for Age, Mileage, Maintenance, and Service Counts are determined when they fall within the following percentages:
<20% = 1 point
20% to 39% = 2 points
40% to 59% = 3 points
60% to 79% = 4 points
>79% = 5 points
Replacement Scale
Each category is scored on a scale from 1 to 5, resulting in a total possible score between 5 and 25. Based on the total score, the asset's condition is assessed as follows:
5-6: Excellent Condition
7–11: Good Condition
12–18: Consider Replacement
19–25: Replacement Needed
Age Projection
Age Projection is the percentage of the asset's current age divided by the Estimated Years. Estimated years will be determined by ‘Override Class Schedule’ and Class Replacement fields (field description below for explanation). Please note that a missing year value will default the Age value to 0.
(Current Year - Asset Year) / (Estimated Life)
Field Descriptions:
Current Year
4-digit value of current calendar year
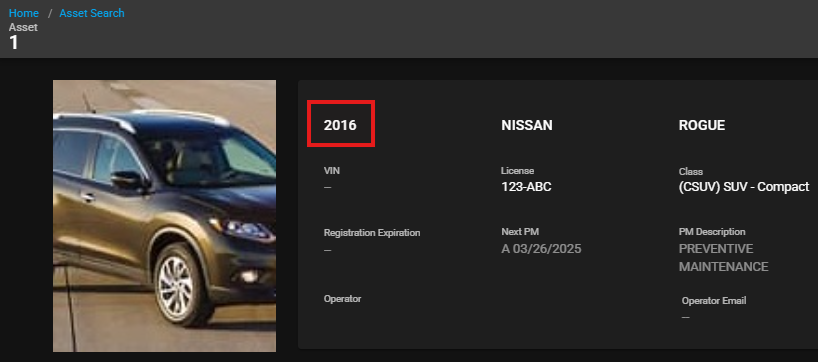
Asset Year
This is the asset’s 4-digit model year. Please note that a missing year value will default the age value to 0.
Estimated Life
This value is the number threshold that you do not want the asset to exceed in its lifecycle.
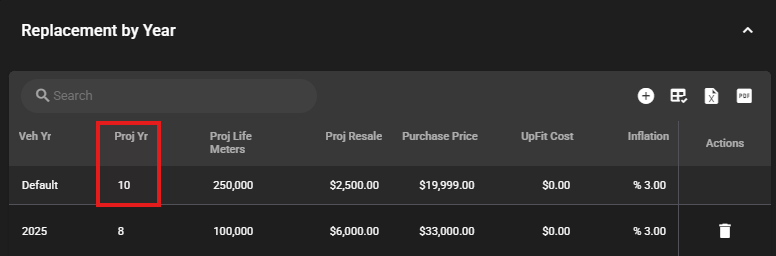
If ‘Override Class Schedule’ is not selected and the asset model year is ‘Default’, then this will pull from Class > Replacement > Replacement by Year > ‘Proj Year’
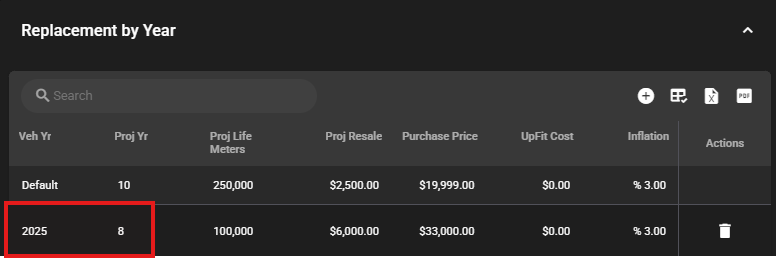
If ‘Override Class Schedule’ is not selected and the asset model year matches a ‘Veh Yr’ value, then this will pull from Class > Replacement > Replacement by Year > ‘Proj Year’
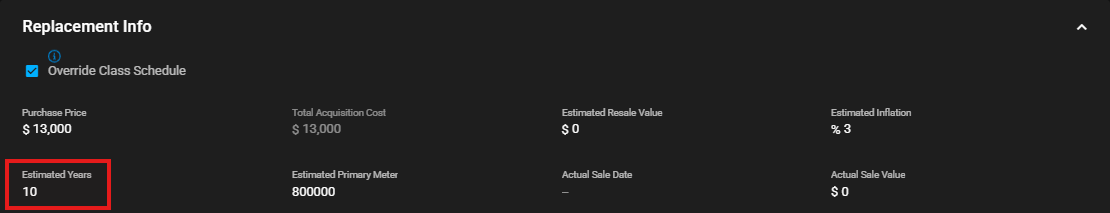
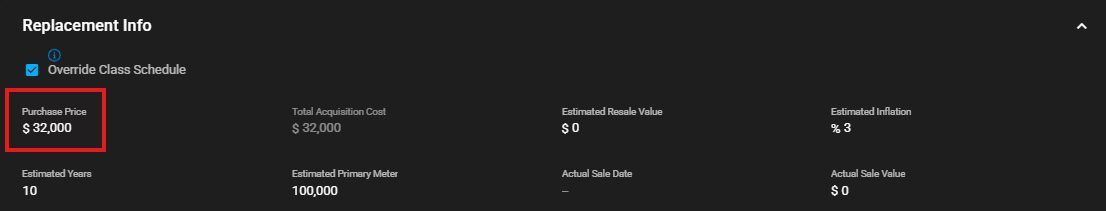
If ‘Override Class Schedule’ is selected, then Asset > Financial > Replacement Info > ‘Estimated Years’
Example
The year is 2025, so a 2022 asset is 3 years old (2025 – 2022 = 3). The class code’s ‘Proj Yr' is 10 years,
3 ÷ 10 = .30 or 30%. 30% is equal to 2 points.
Meter Projection
(Mileage/Kilometers/Hour will be referred to as Units in this example).
The Units Projection is the percentage of the asset’s current Life Units divided by the Estimated Primary Units. The Estimated Primary Units is what you entered in the Class Code that the asset is assigned. The closer the assets current life units are to the Estimated Primary Units, the higher the replacement number.
(Units) / (Projected Replacement Units)
Field Descriptions
Units
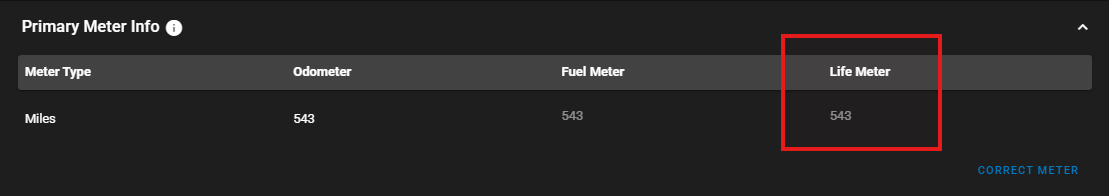
This is the ‘Life Meter’ field in Asset > Asset Management > Primary Meter Info
Projected Replacement Units
This is the meter threshold that you do not want to exceed in the asset’s lifecycle.
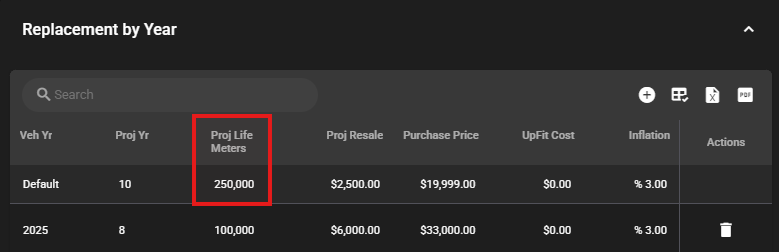
If ‘Override Class Schedule’ is not selected and the asset model year is ‘Default’, then this will pull from Class > Replacement > Replacement by Year > ‘Proj Life Meters’
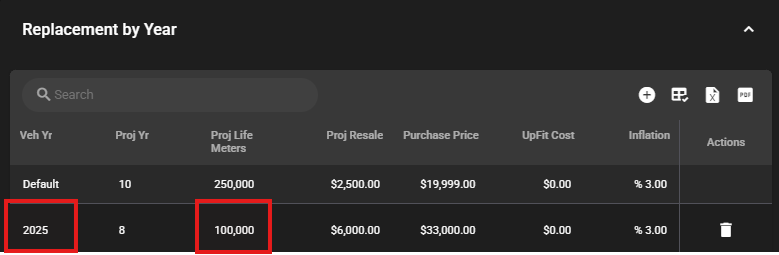
If ‘Override Class Schedule’ is not selected and the asset model year match a ‘Veh Yr’ value, then this will pull from Class > Replacement > Replacement by Year > ‘Proj Life Meters’
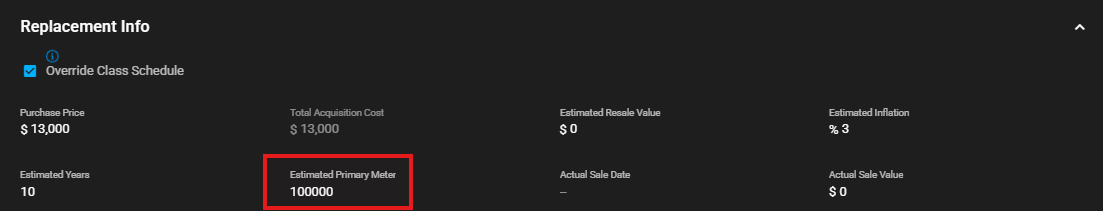
If ‘Override Class Schedule’ is selected, then Asset > Financial > Replacement Info > ‘Estimated Primary Meter’
Example
The asset’s life meter is 58,000 and the Estimated Primary Units is 150,000.
58,000 ÷ 150,000 = .387 or 38.7%. 38.7% is equal to 2 points.
Maintenance & Repair Cost Comparison
The Maintenance & Repair Cost Comparison takes the asset’s total work order costs and divides it by the Total Acquisition Cost (Purchase Price + Asset Upfit Cost + Class Upfit Cost)
(Lifetime Maintenance & Repair Costs) / (Total Acquisition Cost)
Field Descriptions
Total Maintenance & Repair Costs
The Maintenance Cost Comparison is the asset’s work order costs (from Open AND Closed work orders) from the following categories:
Inside parts, labor, and tires
Outside parts, labor, and tires
Miscellaneous work order costs
These costs can be verified by going to Asset > History > Repairs
Total Acquisition Cost
(Purchase Price + Asset Upfit Cost + Class Upfit Cost)
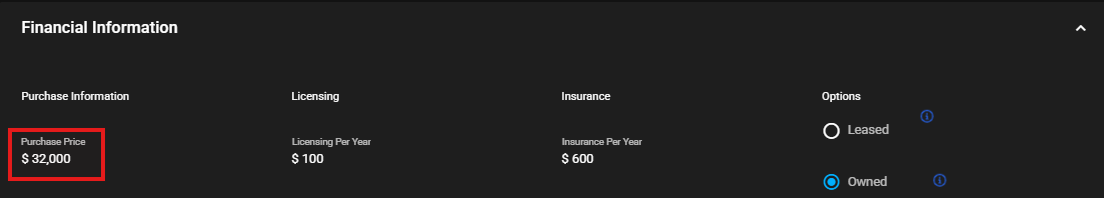
Purchase price is pulled from the Asset > Financial > Financial Information > ‘Purchase Price’ field
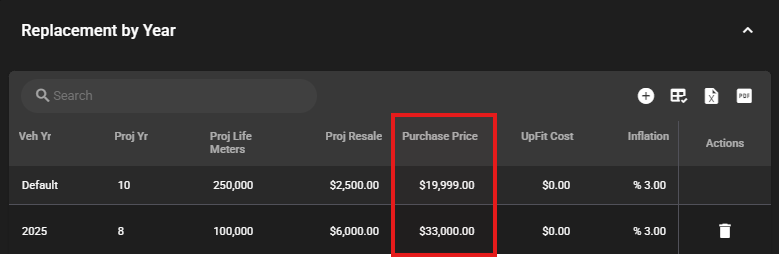
If Purchase Price is blank / $0 and the ‘Override Class Schedule’ is not selected, then Purchase price will be determined by Class > Replacement > Replacement by Year > ‘Purchase Price’ (dependent on whether the asset model year matches a line or is Default)
If Purchase Price is blank / $0 and the ‘Override Class Schedule’ is selected, then Purchase price will be determined by Class > Replacement > Replacement Info > ‘Purchase Price’
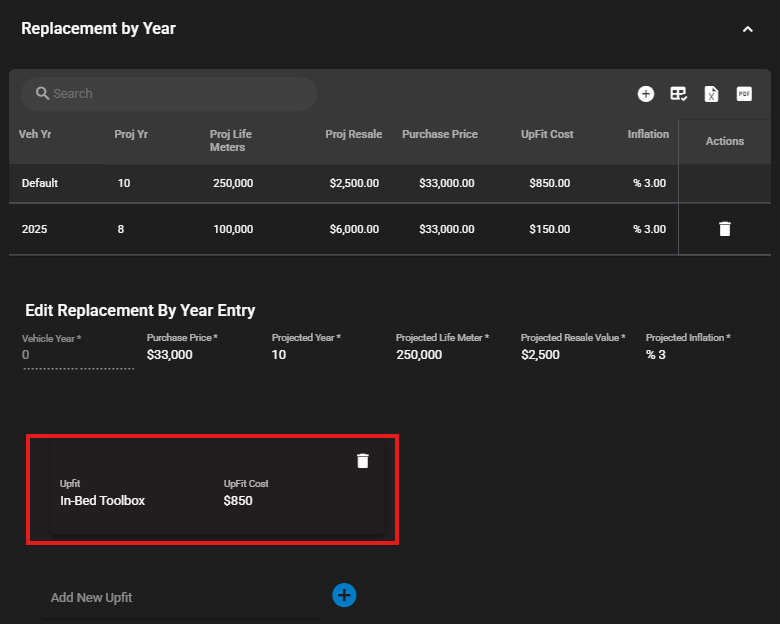
Total Upfit costs are the total combined costs from the asset and Class level.
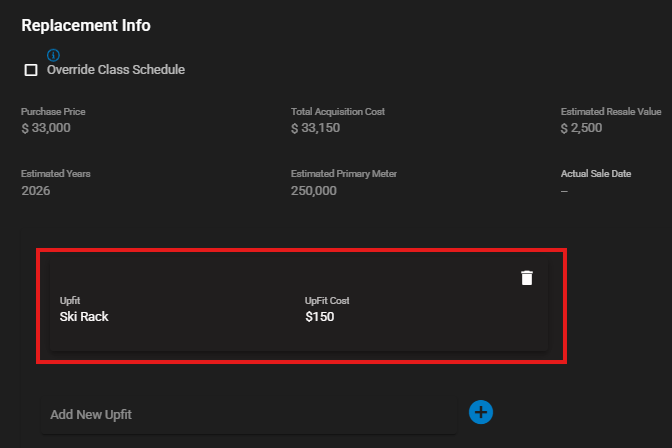
Asset Upfit is added and calculated in the Asset > Financial > Replacement Info section. All upfit items are added together.
Class Upfit is found in Class > Replacement > Replacement by Year section. As with asset, all upfit items are added together.
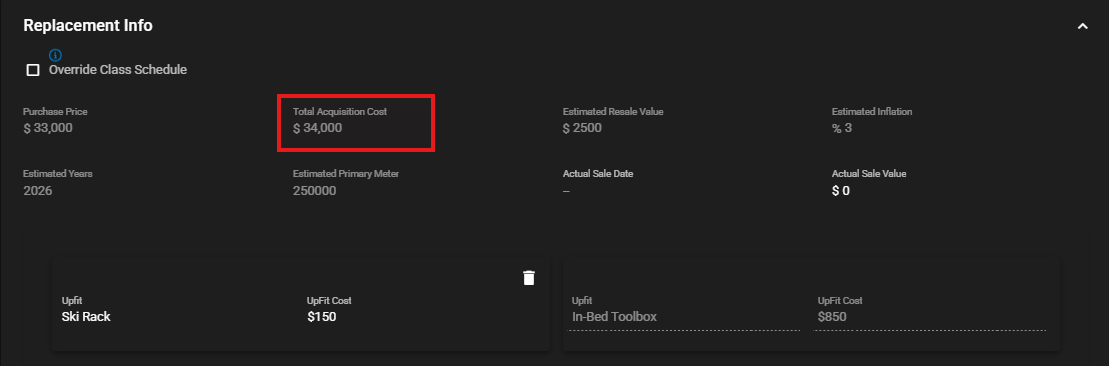
Total Acquisition Cost can be found in Asset > Financial > Replacement Info. The ‘Total Acquistion Cost’ will add Purchase Price, Asset Upfit, and Class Upfit together to get a total.
Example
The asset’s lifetime maintenance and repair cost are $6,359.00, the purchase price was $51,000.00, and total upfit was $1,000.
6,359.00 ÷ (51,000.00 + 1,000) = .122 or 12.2%. 12.2% is equal to 1 point.
Service Count Per Year
If Service Req Count Type = WO,
then (Total Work Orders Closed (in past 365 Days)- Low Service Req Per Year) / (HighService Req Per Year - Low Service Req Per Year)
If Service Req Count Type = WOLine,
then (Total Work Orders Lines From WOs Closed (in past 365 Days) - Low Service Req Per Year) / (HighService Req Per Year - Low Service Req Per Year)
Is a calculation of: Subtract the number of WO’s (or WO lines) from the Min Service Count. Divide this by the sum of the Min and Max Service Count (that you entered in the Class file), to get the percentage. The WO’s (or WO lines) number used in the calculation is the count of WO’s (or WO lines) since the first day of the previous year. Both WO and WO lines are calculated from Closed work orders.
Example
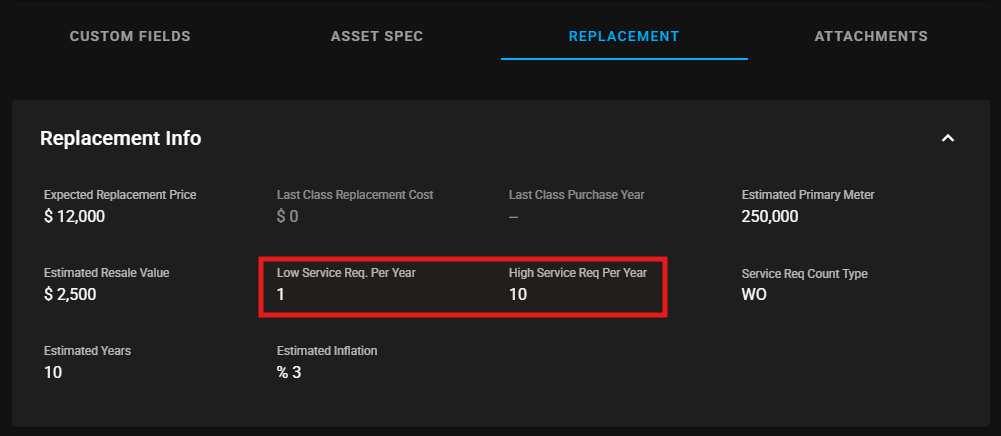
In Class File > Replacement > Replacement Info, the Minimum Service Count is 1, the Maximum Service Count is 10, and the asset’s WO count since the first day of the previous year is 4 WO’s.
(# of WOs) 4 – (Min Cnt) 1 = 3
(Max Cnt) 10 - (Min Cnt) 1 = 9,
3 ÷ 9 = .33 or 33%
33% = 2 points
Condition
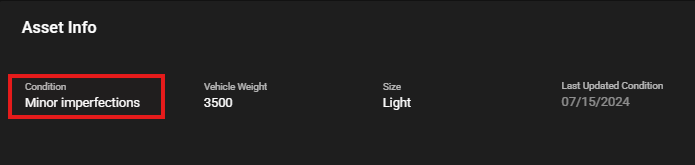
An asset’s condition can be found in Asset > Asset Management > Asset Info > ‘Condition’
The ‘Condition’ dropdown has 5 options that correspond to a numeric condition value:
No visual damage
Minor imperfections
Noticeable imperfections
Accident damage
Inoperative or unsafe
For the condition you’ll want to consider inspections of the body condition, rust, interior condition, accident history, and future repairs. Lower numbers would indicate a good condition and high numbers would indicate a poor condition.
1 = Excellent condition - Interior and exterior no signs of wear, mechanically sound
2 = Asset better than average - Minimal wear inside and out, minor scratches dents, mechanically sound
3 = Average or normal wear and tear, with light cosmetic damage, mechanically sound)
4 = Excessive Wear and Tear - Dents & scratches, body damage, interior wear, engine or transmission not mechanically sound
5 = Severe Wear and Tear - May have collision damage, signs of severe abuse, engine or transmission in poor condition, although unit may be operable it’s near the end of its useful life)