
Fleet Success Scorecard
The Fleet Success Score is an indication of how well a fleet is managing the 4 pillars of fleet success: Stakeholder Satisfaction, Intentional Culture, Resource Efficiency, and Risk Management. The Fleet Success Scorecard is a single score resulting from the combination of the scores from each of the 4 Pillars of Fleet Success.
Similarly, each pillar’s score is the combination of one or more metrics associated with the success of that pillar. The score is meant as an internal indicator for a fleet to track over time. As fleets are different it may not make sense to compare them. However, we do include an “industry average” and a “top performer” indicator on the graph to provide some reference. These views can be set to observe a sequence of data weekly, monthly or quarterly.
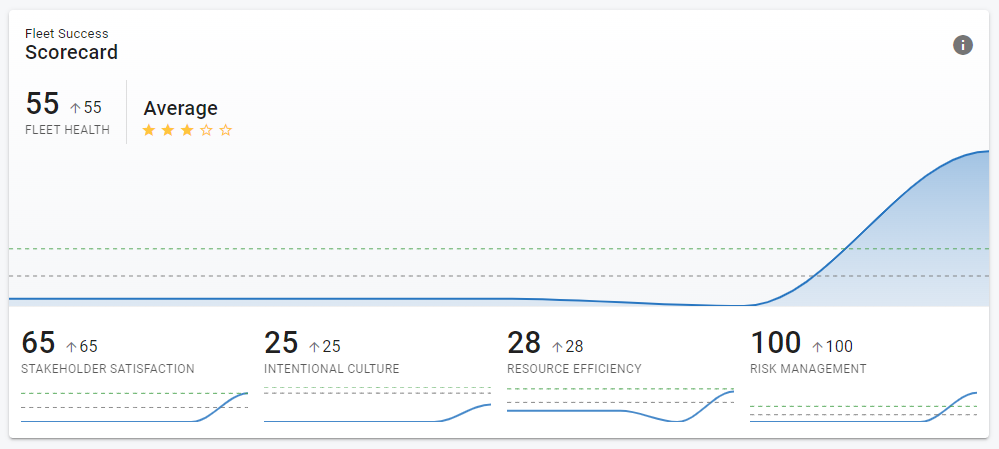
Setting Up the Four Pillars
Before you begin
The Fleet Success Scorecard is turned on for your organization by RTA. If the Fleet Success menu is missing or greyed out, the feature or one of its pillars has not been enabled for your organization.
Your user group needs the Fleet Success permissions (Admin > User Groups). FSS View Summary Charts lets you see the scorecard; FSS Edit Settings is required to manage the surveys; opening a pillar’s detail screen also requires Facility Maintenance (Master/Setup > Facilities/Regions).
Where to find it
Open the Fleet Success menu in the left navigation. The scorecard shows the overall score and the four pillar scores; each pillar has its own screen (Stakeholder Satisfaction, Intentional Culture, Resource Efficiency, Risk Management) in the same menu. Depending on how your organization is configured, the score band may also appear on the Home page (FleetHQ).
What each pillar needs
Pillar | Measured from | Setup required |
|---|---|---|
Stakeholder Satisfaction | CSAT and NPS survey responses | Yes – activate the CSAT survey and set up the NPS survey and its recipients (see below). |
Intentional Culture | eNPS survey responses | Yes – activate the eNPS survey and add employee recipients (see below). |
Resource Efficiency | Your completed Work Order lines (Scheduled Jobs %) | No survey setup. Data comes from the Work Orders you close; use PM repair types for scheduled work. |
Risk Management | Your completed PMs (On Time PMs %) | No survey setup. Data comes from PM history; keep PM schedules and Due Soon values current on the asset PM tab. |
A pillar only counts the metrics that have recorded data. Until a survey has responses, or until Work Orders and PMs have been completed, the pillar shows as not reporting and the missing metric counts as zero in the pillar score. Additional metrics may appear under a pillar over time; each one you can see is included in that pillar’s score once it reports.
Stakeholder Satisfaction
Stakeholder satisfaction is based on a combination of Net Promoters Score (NPS) and Customer Satisfaction (CSAT) rating. These indicators require setup to configure the surveys and plan their delivery.
Click on the info icon on each for more instructions.
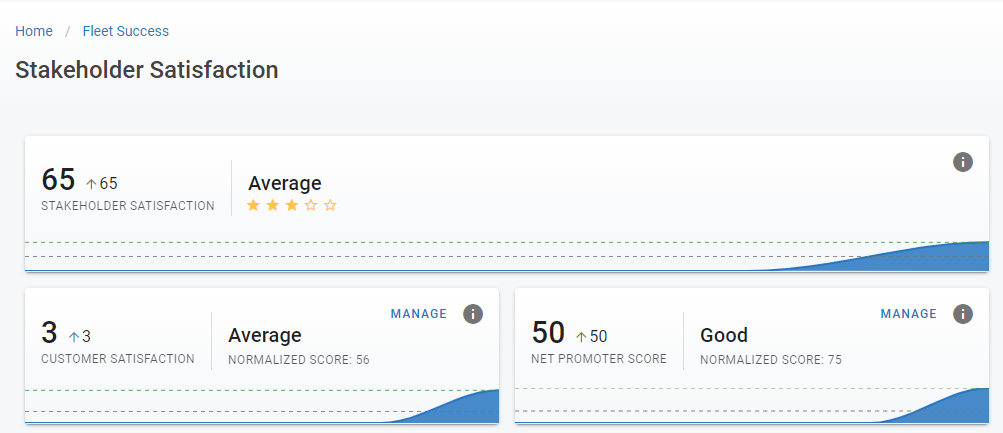
Both the Customer Satisfaction and Net Promoter Score totals are resourced from clicking on each box. A list of survey results will appear with details. When you click on “Manage”, the survey details will show so they can be updated or added.
CSAT is the result of surveys given to customers at the time work is completed on their vehicle. The CSAT score reflects the customers satisfaction and has a range from 0 to 100. Therefore, the CSAT does not require normalization to be combined with other fleet success scorecard indicators.
NPS is the result of a survey typically sent quarterly to fleet customers. The NPS score is calculated as the percent of promoters minus the percent of detractors. Where 0-6 are detractors and 9-10 are promoters. (7-8 are considered passively satisfied and are not included in the score.) This results in a score ranging from -100 to 100. This NPS score is then normalized, or converted, into range from 0 to 100. For example if the NPS score is -100 then the normalized NPS score is 0. The normalized score allows combining other scores in a meaningful way.
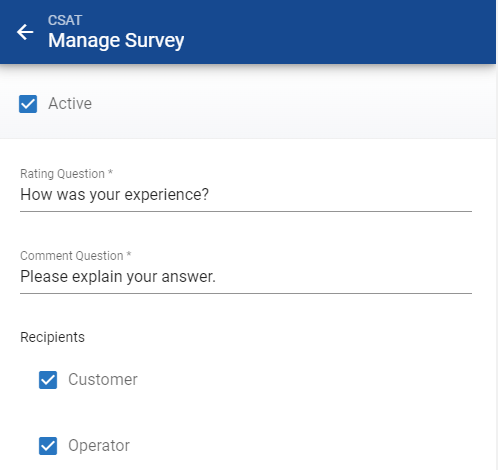
Customer Satisfaction surveys are configured from the CSAT Manage screen: enter the survey Question and Comment Question, choose the recipients (Customer and/or Operator) and switch the survey to Active. While Active, a survey email is sent automatically each time a Work Order is closed, to the asset’s Customer and/or Operator – the recipient must have an email address on their record, and each recipient receives one survey per Work Order. Use Send Test Email to preview the email before you activate it.
Net Promotor Score surveys are emailed on a schedule to the contacts you subscribe, such as department heads, customers or drivers. To manage recipients, click the NPS box to open the survey results, then click the people icon in the toolbar at the top of the results. The Recipients screen lists everyone currently subscribed; use Subscribe to pick contacts to add and Unsubscribe to remove them. Changes apply to the next send.
Who can be a recipient: any contact on file (Contacts in the Fleet360 menu) - customer, operator, department, supervisor, technician, vendor or custom contact types alike. The contact must have an email address; contacts without one are listed but never receive a survey, and one email address receives one survey per send even if several contacts share it. The Customer/Operator-only choice applies to the CSAT survey, not to NPS or eNPS. Refer to Contact Types and Contact Profile.
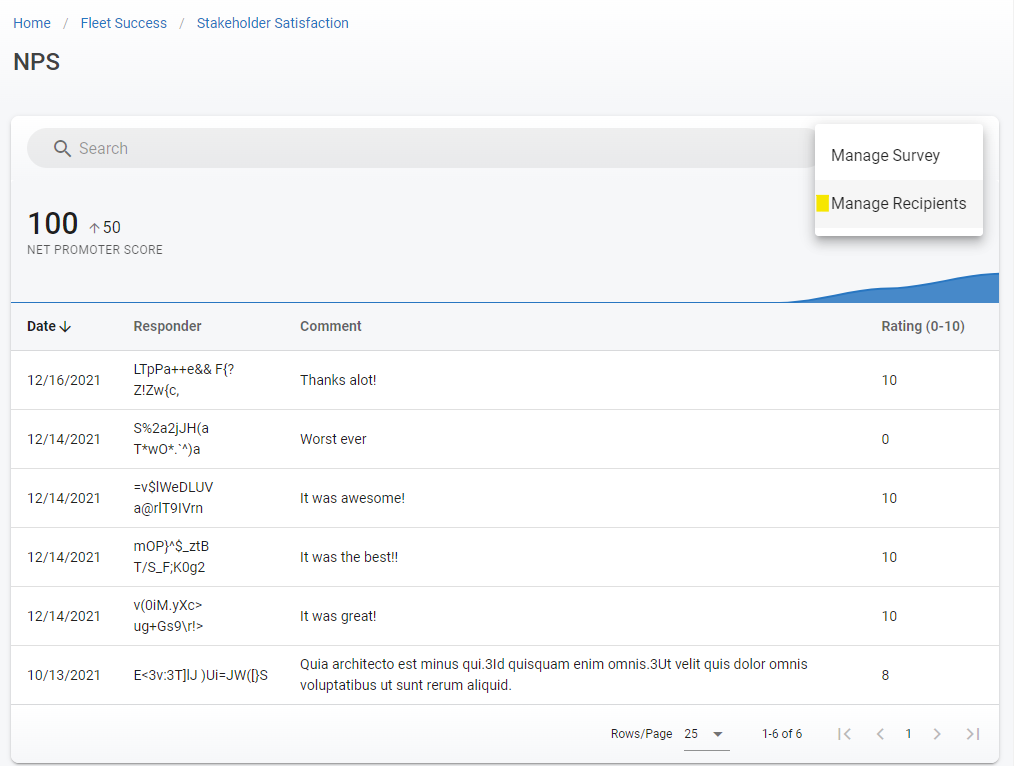
Use “Subscribe” and “Unsubscribe” to toggle which users will be receiving the NPS surveys moving forward.
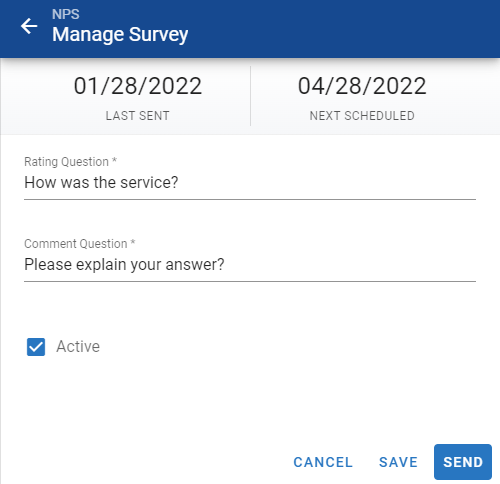
To edit the survey itself, click the pencil icon (Manage Survey) in the same toolbar, or Manage on the Stakeholder Satisfaction screen. The drawer shows the Last Sent and Next Scheduled dates and lets you edit the survey Question and Comment Question, turn the survey Active on or off, and send yourself a test email. Click Save to keep the changes. The survey is emailed to your subscribed recipients automatically on its recurring schedule while it is Active; click Send at the bottom to push a round of surveys to your recipients now.
When NPS and eNPS Surveys Are Sent
Both surveys run on the same quarterly cycle:
First send: the Next Scheduled date is set to three months after the survey is first saved. Nothing is sent before that date, and nothing is sent unless the survey is Active and has subscribed recipients with email addresses.
After each send: the next send is scheduled three months after the date it was actually sent. Fleet360 checks the schedule about once an hour, so a survey due today goes out within the hour of its scheduled time.
Send now: Send emails every subscribed recipient immediately and restarts the clock, so the next automatic send moves to three months from today.
Turning Active off pauses sending but keeps the schedule. When you turn it back on, a Next Scheduled date that has already passed is sent at the next hourly check.
The three-month interval and the Next Scheduled date cannot be changed on the Manage Survey screen. To start a cycle sooner, use Send.
Intentional Culture
The Intentional culture score is currently based on an employee NPS (eNPS) score. This score indicates how likely an employee is to recommend their workplace to others. This indicator requires a setup the first time.
Clicking on the info icon for eNPS will provide help with the setup.
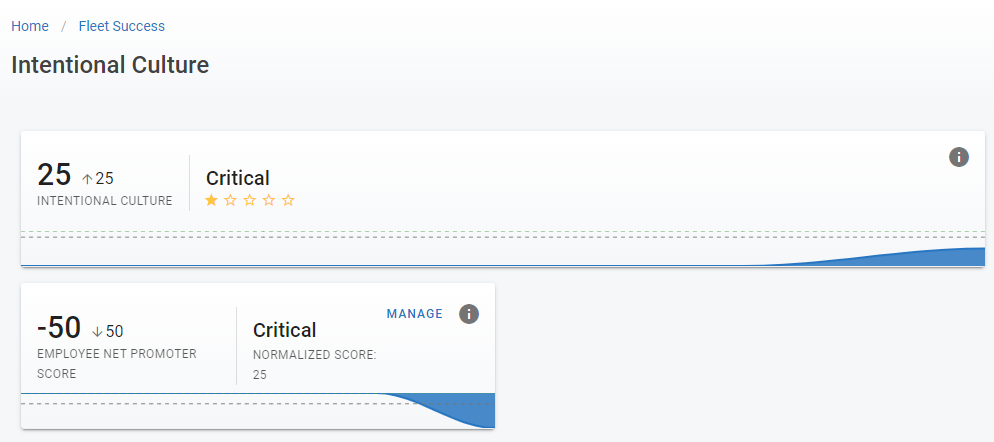
Similar to a customer-based NPS score, the Employee Net Promotor Score results come from a survey that can be regularly submitted to your employees to provide feedback to the leaders for shop/department health.
This survey is typically given once a quarter and measures whether an employee would recommend their workplace to others. It is scored similarly to the NPS score: percent of promoters minus percent of detractors where responses of 0-6 are detractors and responses of 9-10 are promoters (Responses 7-8 are considered passively satisfied and are not included in the score).
The eNPS ranges from -100 to 100 and therefore needs to be normalized, or converted, to a range of 0 to 100 to be combined with other indicators. For example, and eNPS of -100 would result in a normalized value of 0.
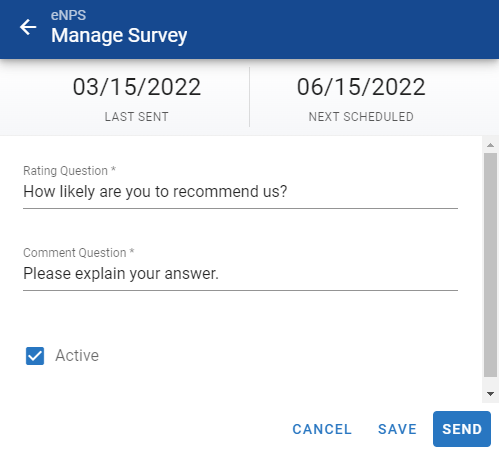
By clicking on the Employee Net Promotor Score box, the user can view recently submitted eNPS surveys to review comments and scores that make up the final score. To set up the survey, click Manage on the Intentional Culture screen or the pencil icon in the results toolbar. This will allow you to modify the survey questions, activate the survey, view the last sent and next scheduled dates, send a test email, and click Send to push a round to your recipients now. Recipients only receive the survey while it is Active; the schedule is the same quarterly cycle described under When NPS and eNPS Surveys Are Sent above.
To manage eNPS recipients, click the people icon in the toolbar at the top of the eNPS results. Use Subscribe to add contacts and Unsubscribe to remove them. Recipients are taken from the same Contacts list as NPS: add your employees as contacts (for example with the Technician or Supervisor contact type) with an email address, then subscribe them here. A contact can be subscribed to NPS, eNPS or both.
Resource Efficiency
The Resource Efficiency score is currently based on the percent of all maintenance jobs that are “Scheduled”.
Scheduled Jobs: This score is the percent of all maintenance jobs that are classified as “Scheduled”. This measure can range from 0 to 100. Since this is the same range of the normalized scores it can be combined without normalization.
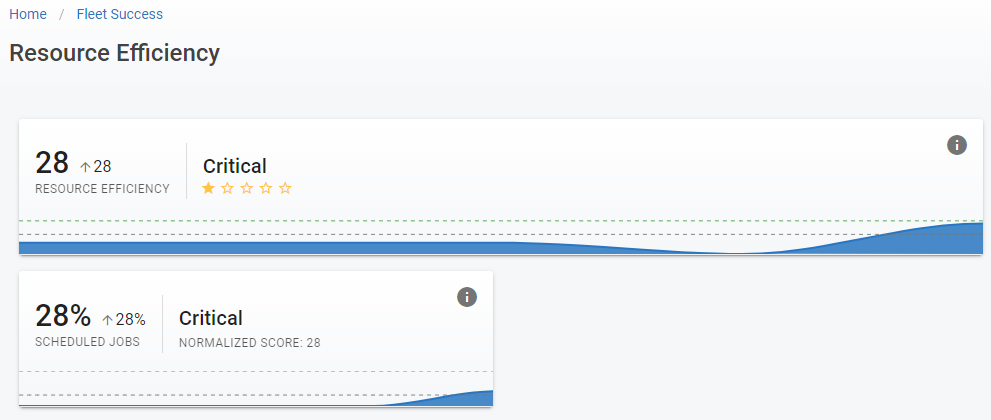
Resource Efficiency is not managed like the survey-based pillars; there is nothing to configure. The score is calculated automatically from the Work Order lines completed in the last 90 days: a line counts as “Scheduled” when its repair type is flagged as a PM repair type (or has the abbreviation PM), and every other completed line counts as unscheduled. To grow the score, complete PM work through Work Orders and make sure scheduled work is posted with a PM repair type.
Reason codes do not count. Only the repair type on each completed Work Order line decides whether it is Scheduled. A line with a “Scheduled” or “PM” reason code but a non-PM repair type is counted as unscheduled, and a line with a PM repair type is Scheduled regardless of its reason code.
Risk Management
The Risk Management Score is currently based on the percent of PMs completed on time.
On Time PMs: This score looks at when PMs are completed and provides the percent that are completed on time. This indicator has a range from 0 to 100 which is the same range for the normalized score so it can be added without normalization.
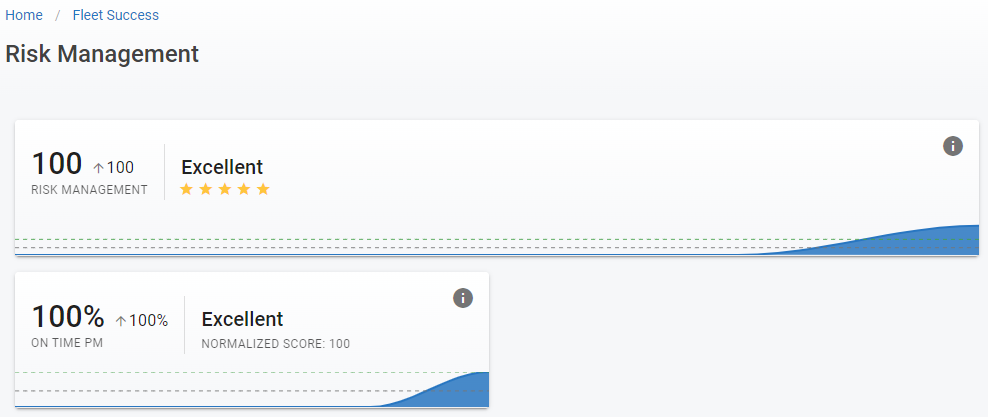
There is nothing to configure for this pillar. The score is calculated automatically from the PMs completed in the last 90 days. A PM counts as “on time” when it is completed before it becomes Past Due – that is, while it is Not Due, Due Soon or Due Today. The Due Soon window is set on each PM interval on the asset’s PM tab (or with Set PM for many assets at once) and defaults from your facility settings.
Refer to Set PM (Bulk PM Edits).
As PMs help to prevent the breakdown, accuracy in PM scheduling will determine the Risk Management.