Parts Activity
Summary/Use Case
Report Summary
The Parts Activity report summarizes inventory movement for each part since a specified start date, showing beginning inventory (as of that date), purchases, usages, adjustments, and current inventory value. Fleet managers can use this to reconcile stock movement, validate period activity, and quantify inventory value changes by part type or location.
Use Case
Reconcile monthly inventory by comparing beginning balances, activity, and current on-hand totals
Identify high-usage parts to refine min/max and reorder strategies
Audit adjustments to spot counting or data-entry issues
Report inventory value by category (e.g., Tires, Oil) for finance and compliance
Location: Where to Find It
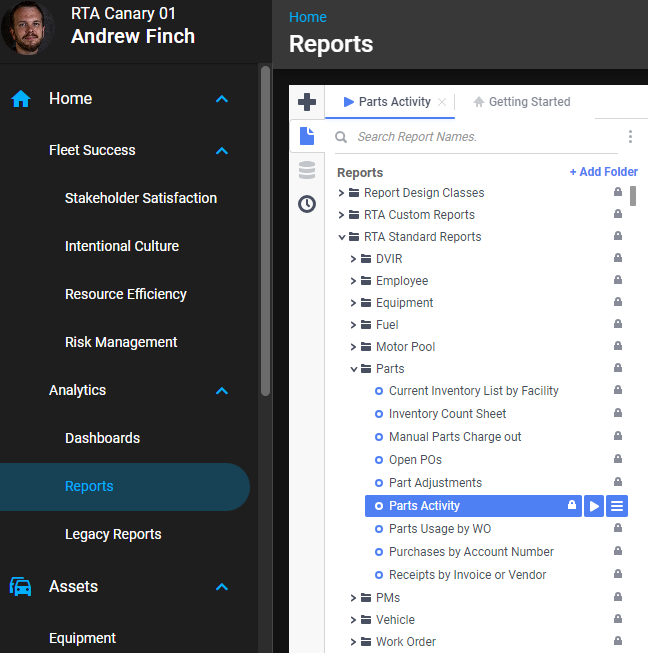
Reports > RTA Standard Reports > Parts > Parts Activity
Data Filter Prompts
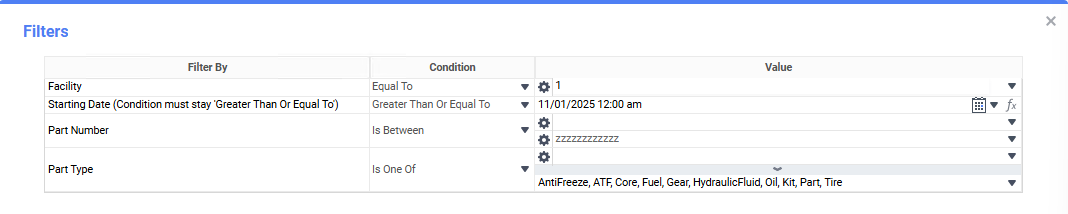
You will be prompted for filtering of the Data to specify and narrow down the data that will be pulled. See Data Filter List Below for Options.
Data Filter List
Filter Name | Recommended Filter Condition(s) | Value (Options) | Value (Default) | Value (Notes) |
|---|---|---|---|---|
Facility | Equal To | Valid facility IDs | 1 | Filter to the location you want to analyze. |
Starting Date (Condition must stay ‘Greater Than Or Equal To’) | Greater Than Or Equal To | Any valid date/time | 11/01/2025 12:00 am | Establishes the period start; the report calculates beginning inventory as of this date using current avg price. |
Part Number | Is Between | Low: blank; High: zzzzzzzzzzzz | Low: blank; High: zzzzzzzzzzzz | blank and “zzzz…” represent the first and last possible values for this field (full range). |
Part Type | Is One Of | AntiFreeze, ATF, Core, Fuel, Gear, HydraulicFluid, Oil, Kit, Part, Tire | AntiFreeze, ATF, Core, Fuel, Gear, HydraulicFluid, Oil, Kit, Part, Tire | Choose one or more categories to focus the report. |
Report Output and Data Elements
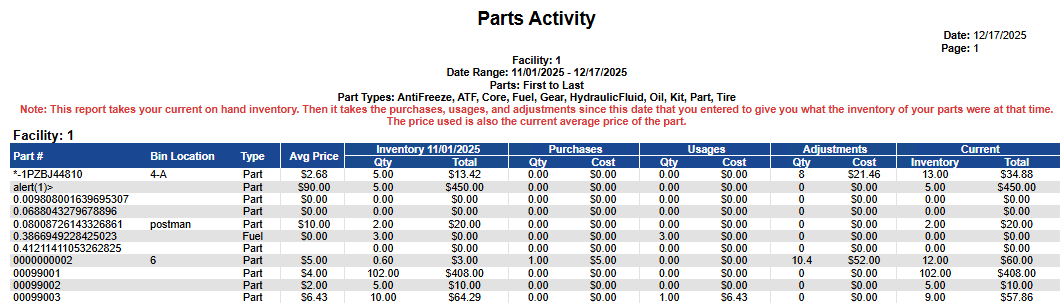
The Parts Activity report lists each part with bin location, part type, average price, calculated beginning inventory as of the starting date, activity since that date (purchases, usages, adjustments), and current inventory quantity/value. A totals row summarizes by facility: Beginning Inventory Qty/Total, Purchases Qty/Cost, Usages Qty/Cost, Adjustments Qty/Cost, and Current Inventory Qty/Total.
Report Output
Report Data Elements
Column Number | Column Title | Data Notes (the purpose of that datapoint) |
|---|---|---|
1 | Part # | Primary part identifier |
2 | Bin Location | Storage/bin location within the facility |
3 | Type | Part category (e.g., Tire, Oil, Part, Fuel) |
4 | Avg Price | Current average unit cost used for valuation |
5 | Inventory <Start Date> — Qty | Calculated quantity on hand as of the selected starting date |
6 | Inventory <Start Date> — Total | Beginning inventory value (Qty × Avg Price) |
7 | Purchases — Qty | Quantity received after the starting date |
8 | Purchases — Cost | Extended cost of purchases after the starting date |
9 | Usages — Qty | Quantity issued/used after the starting date |
10 | Usages — Cost | Extended cost of issued quantities |
11 | Adjustments — Qty | Net quantity change due to adjustments after the starting date |
12 | Adjustments — Cost | Extended cost value of those adjustments |
13 | Current — Inventory (Qty) | Current on-hand quantity at report run time |
14 | Current — Total | Current inventory value (Qty × Avg Price) |