RTA Web - Dashboards - Top 5 Reports
Some Web browser settings may cause Dashboards to not load. Click here for a list of instructions to update or change your web browser settings. If the issue continues please reach out to tech support for further assistance.
Vehicle Audit
Repair History (VMRS History)
Replacement Scoring (Priority)
PO Transactions
Fuel by Class Code
Fuel by Department
Fuel by Customer
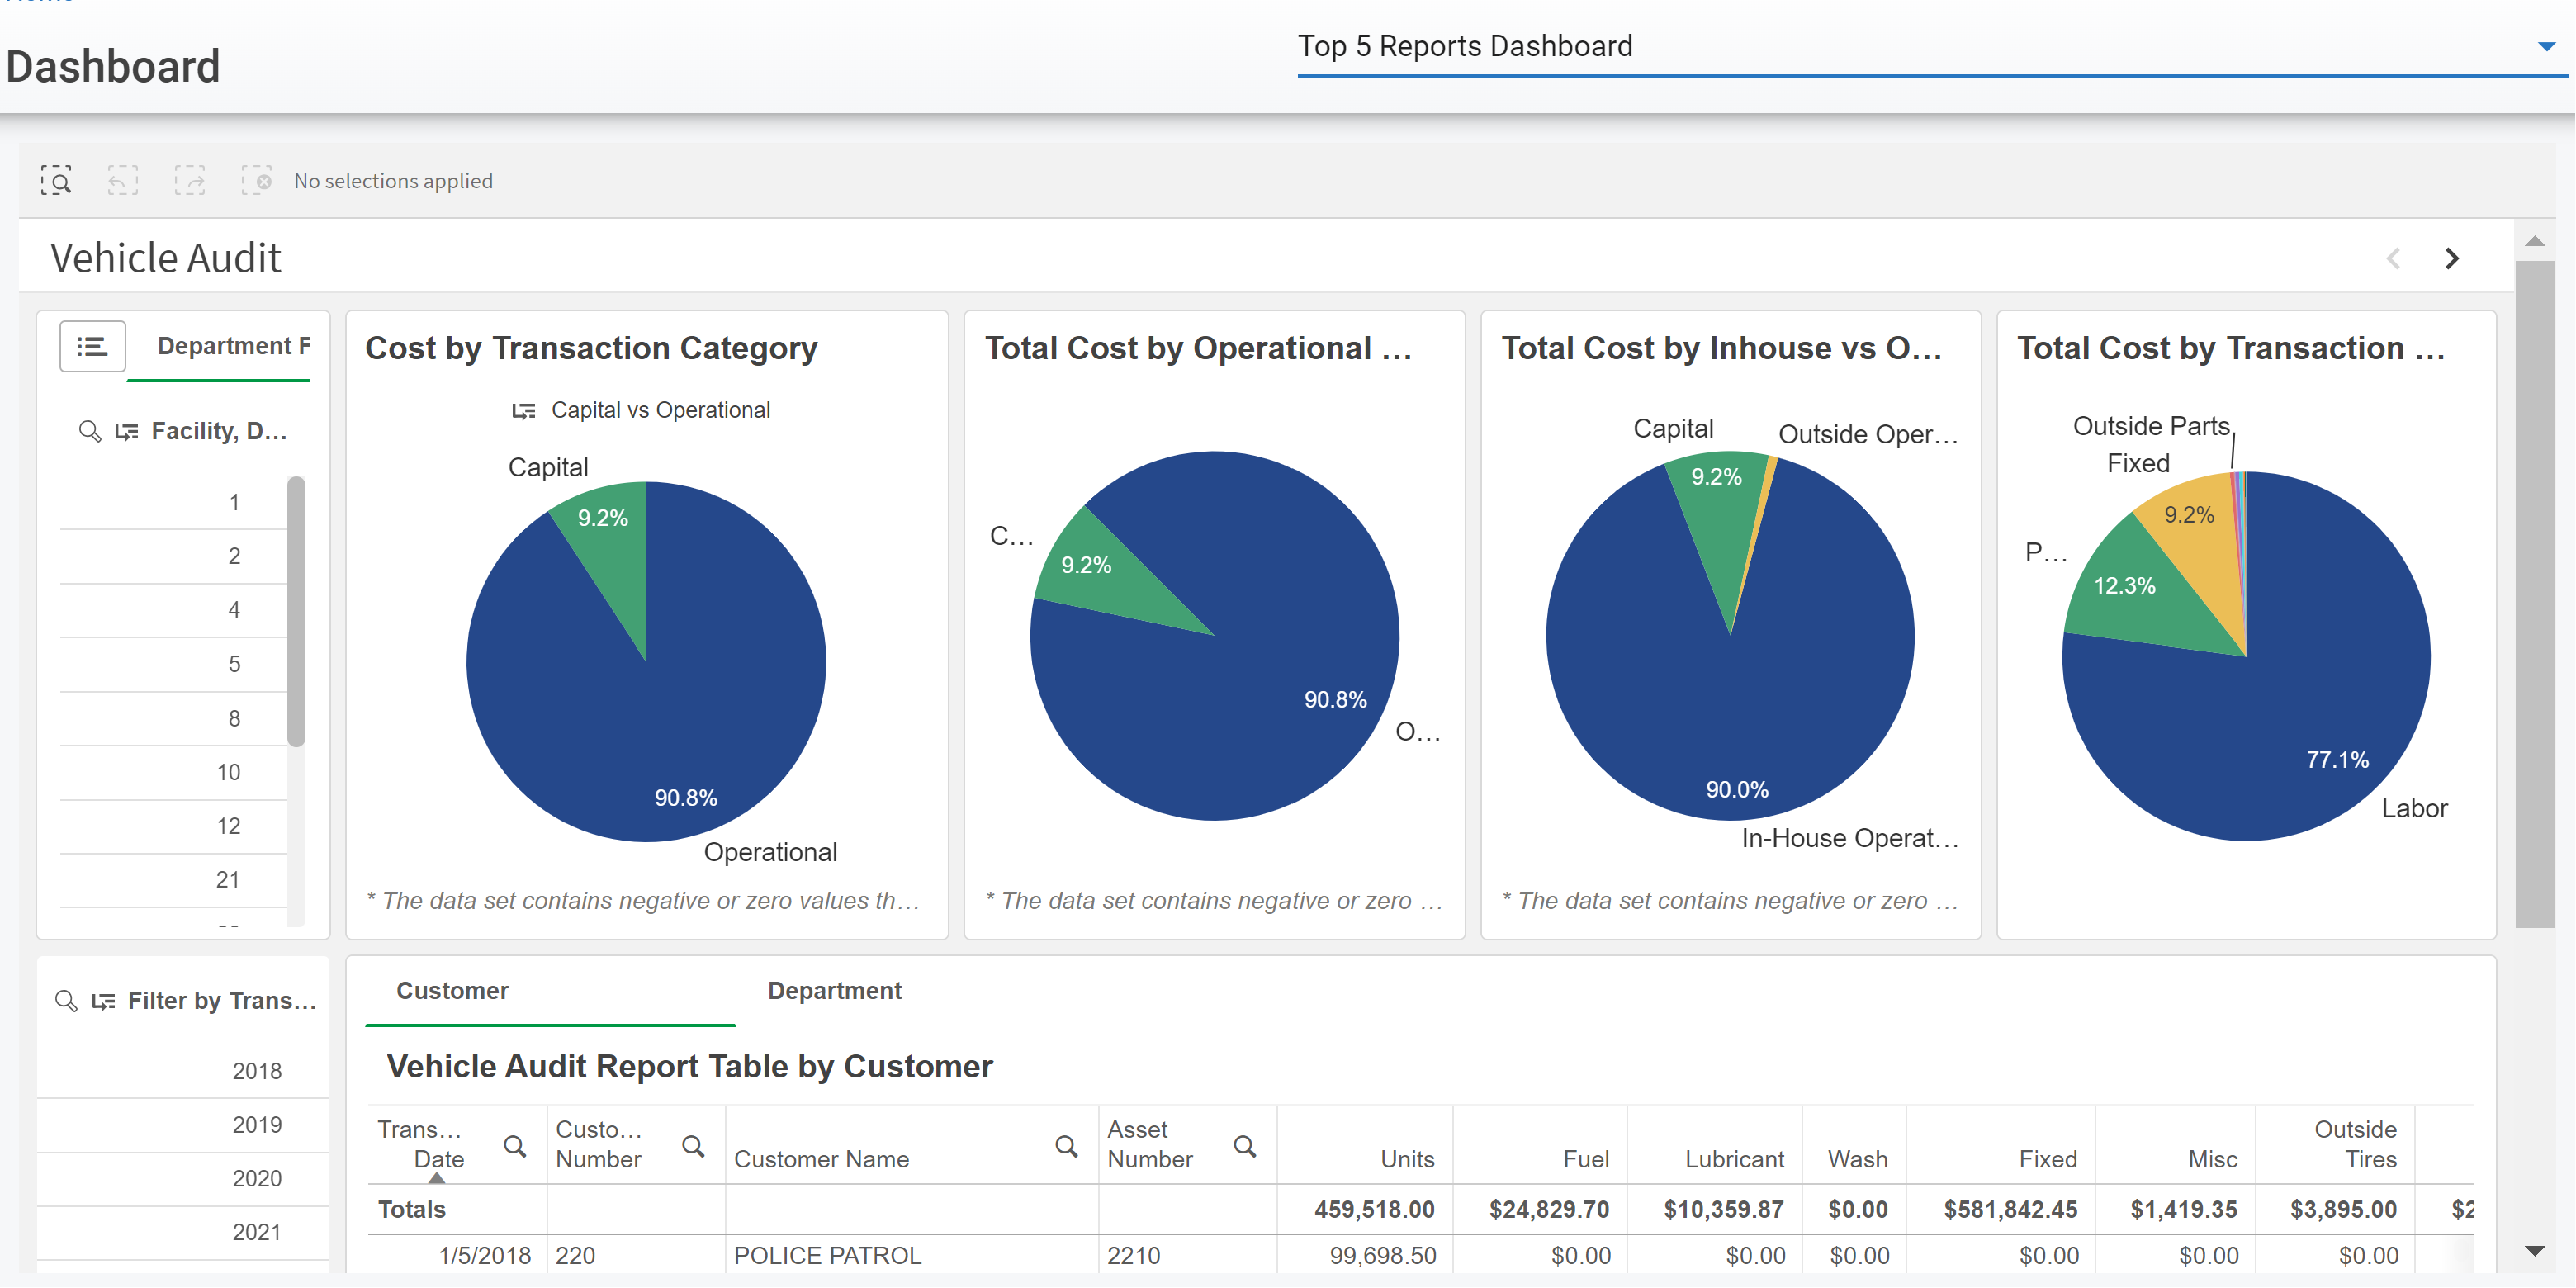
Vehicle Audit
Cost by Transaction Catergory | Capital versus Operational | Capital is fixed asset cost (depreciation, insurance, and registration), Operational is fuel, maintenance and repair, washes, and outside maintenance and repiar |
Total Cost by Operational Versus Capital | ||
Total Cost by In house Versus Outside Operational Versus Capital | In House versus Outside Maintenance and Repair | |
Total Cost by Transaction Catergory | ||
Vehicle Audit Report by Customer | Line item cost by asset assigned to Customers | |
Vehicle Audit Report by Department | Line item cost by asset assigned to Departments |
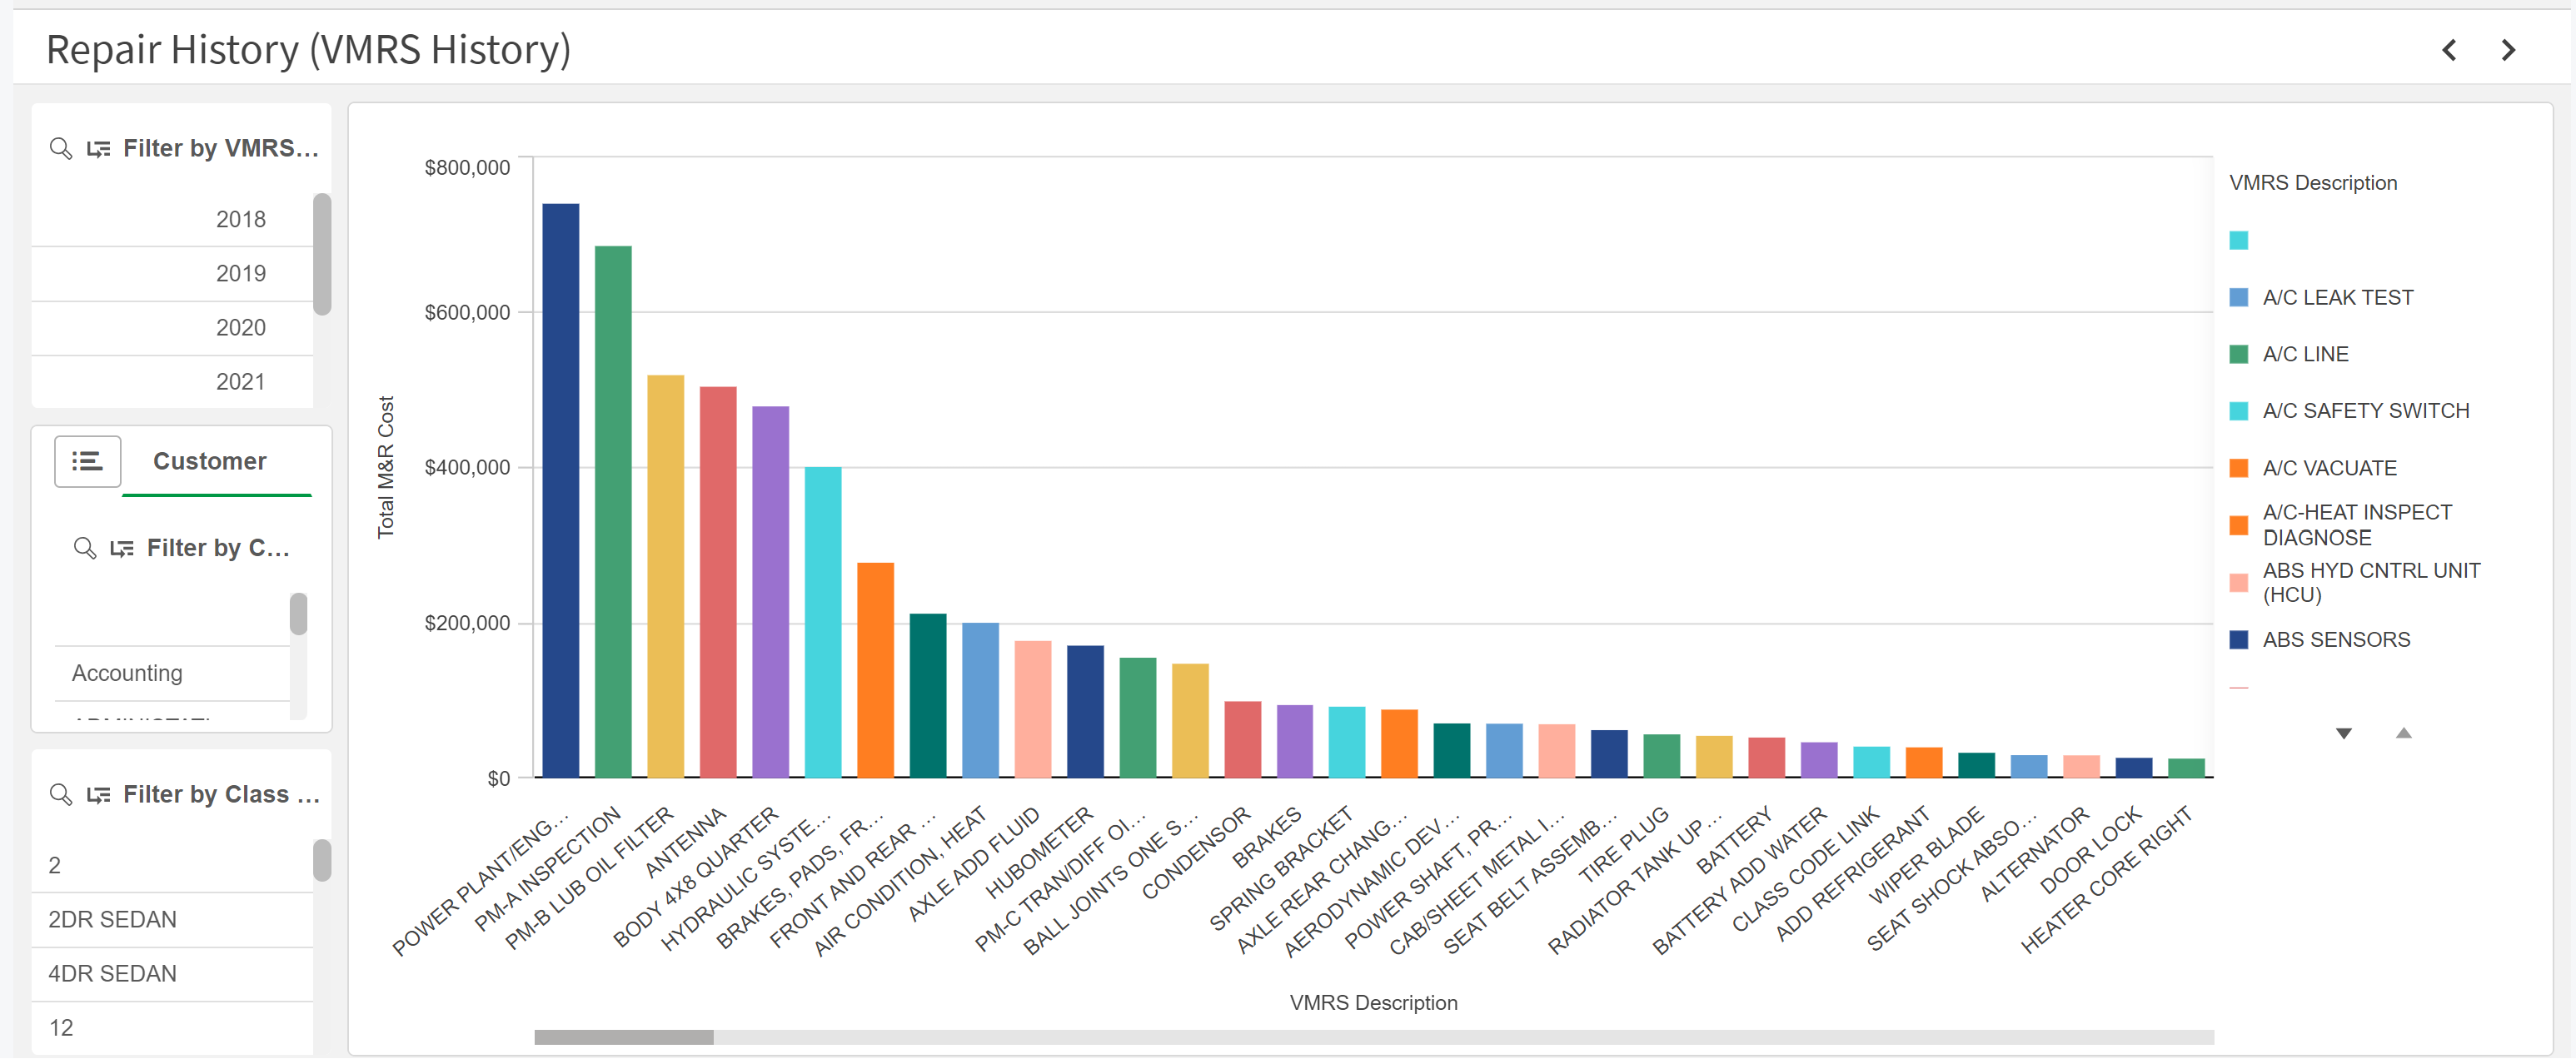
Repair History (VMRS History)
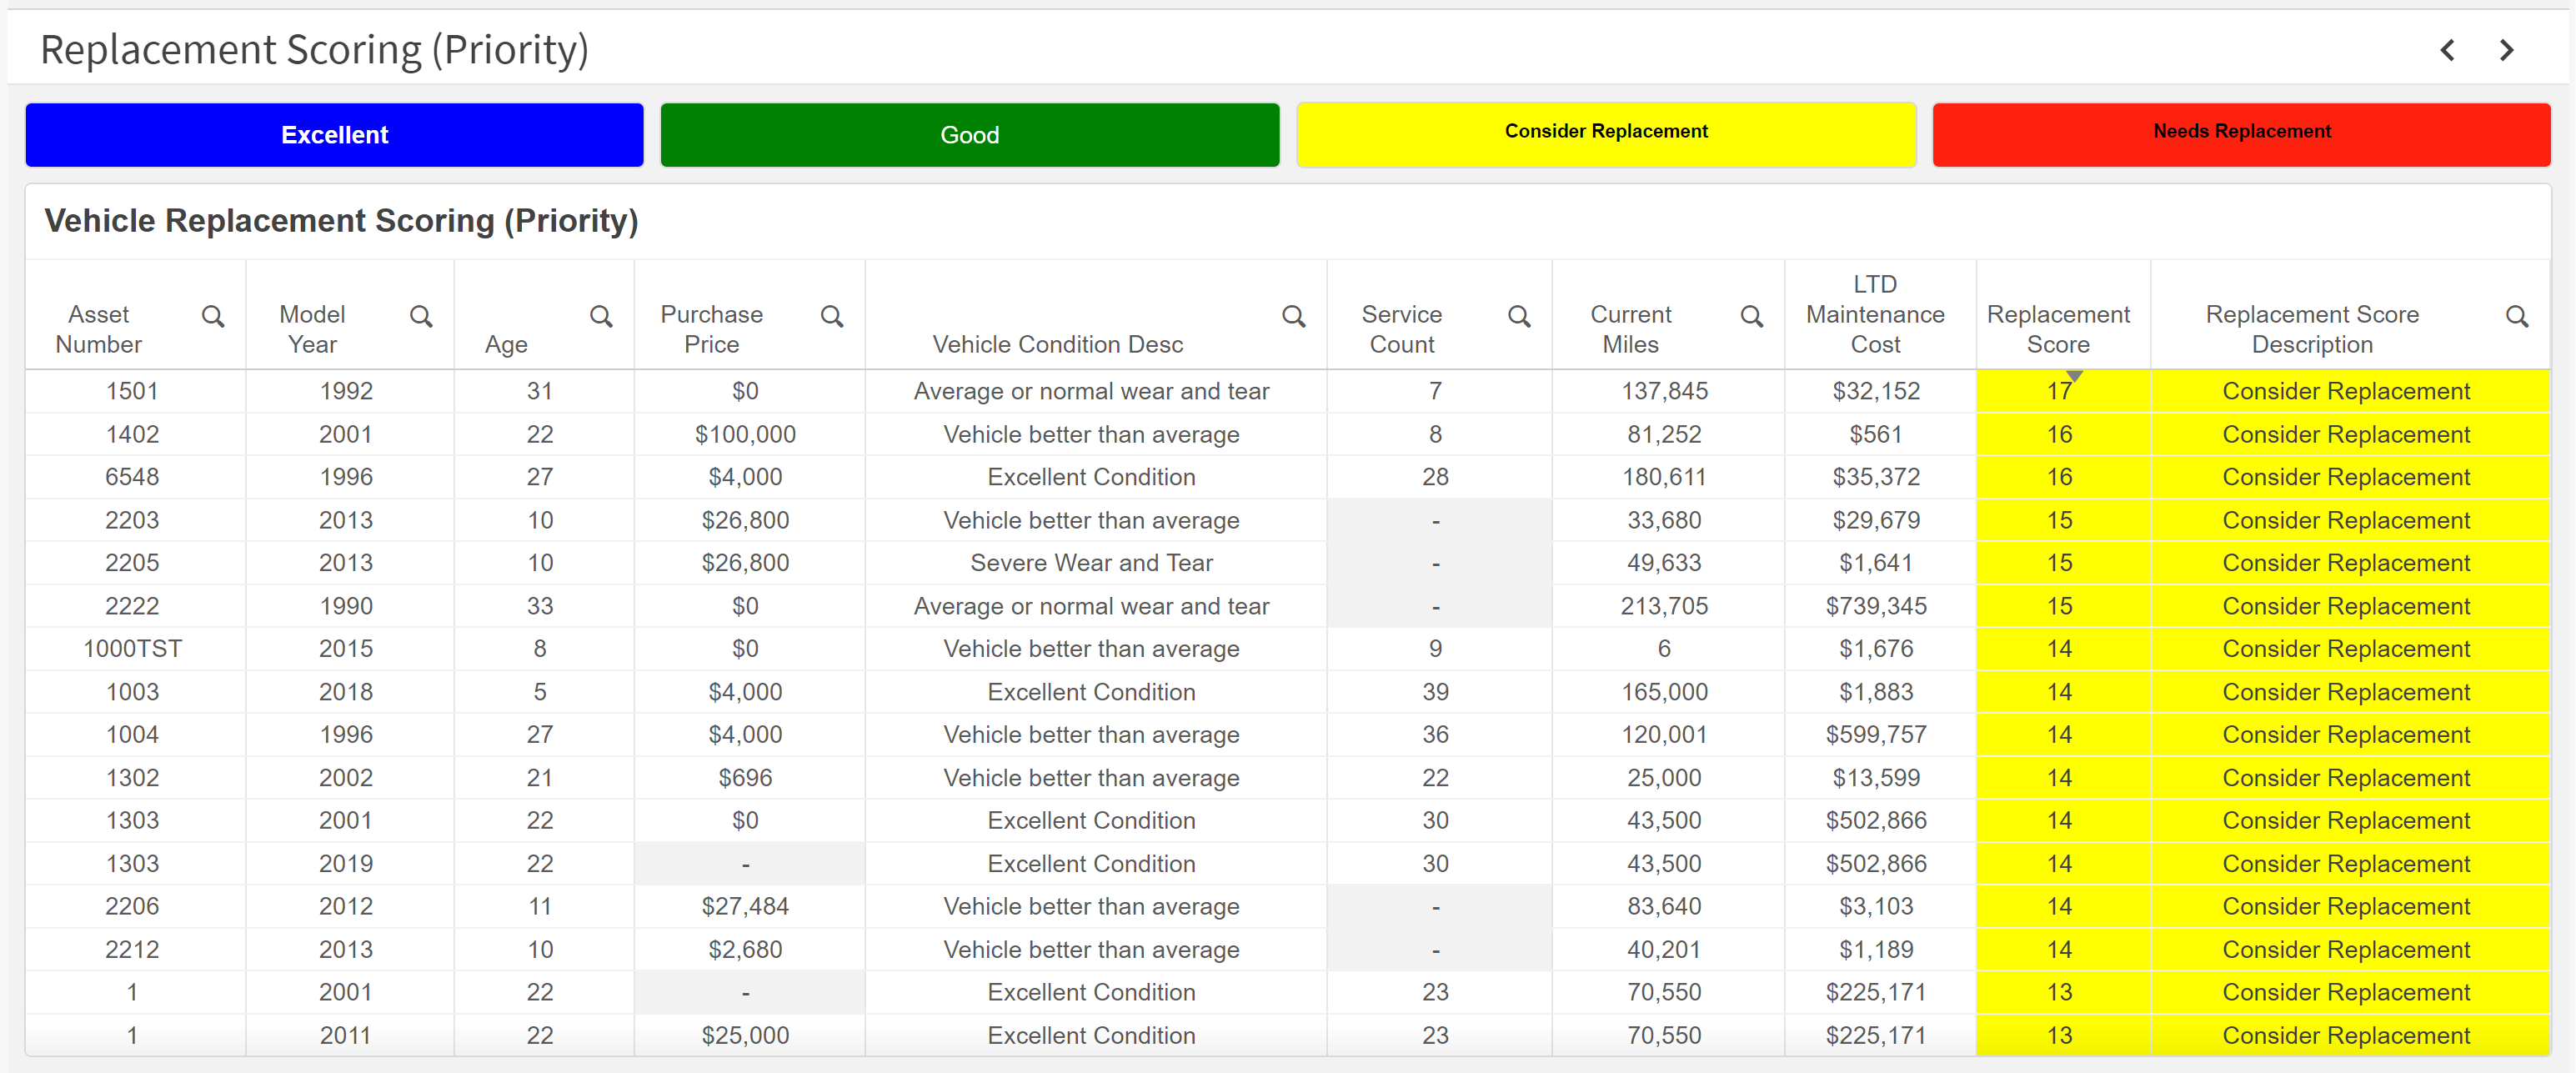
Replacement Scoring (Priority)
PO Transactions
PO Transaction Totals | ||
|---|---|---|
PO Transaction Total Cost | Blue Line On Chart | |
PO Total Quanity of Parts | Green Line on Chart |
Fuel by Class Code
Fuel by Class Code | ||
|---|---|---|
Fuel Cost by Class Code | ||
Miles Traveled by Class Code |
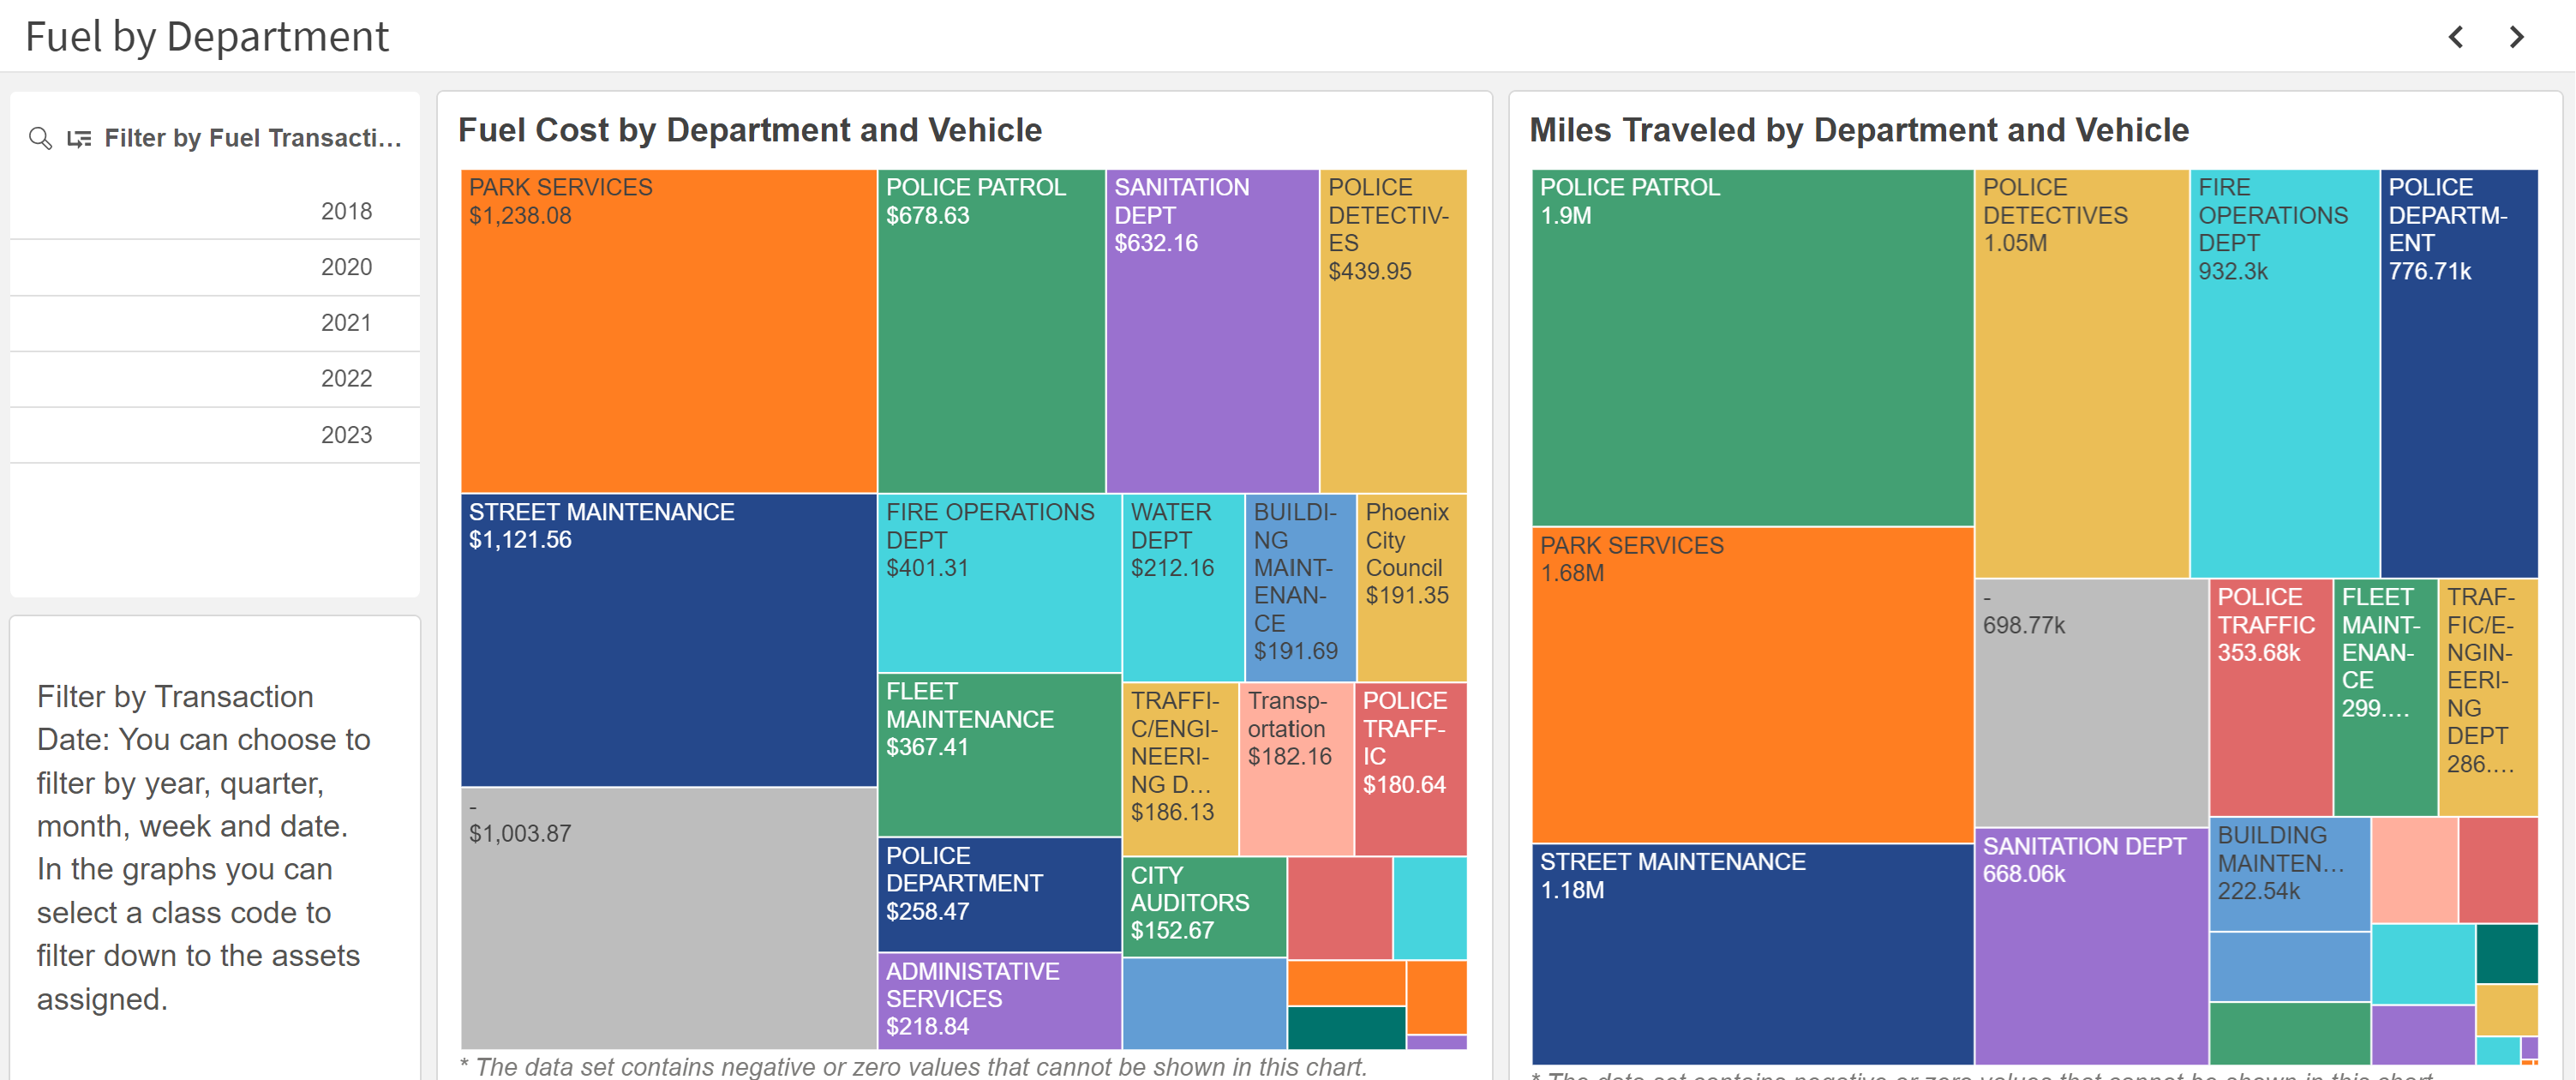
Fuel by Department
Fuel by Department | ||
|---|---|---|
Fuel Cost by Department | ||
Miles Traveled by Department |
Fuel by Customer
Fuel by Department | ||
|---|---|---|
Fuel Cost by Customer | ||
Miles Traveled by Customer |


