Vehicle Replacement Scoring Report
There are many ways or methods to calculate when it’s time for vehicles or equipment to be replaced. Each vehicle has its own characteristic’s or history, so maintenance costs should also play a factor in determining when a piece of equipment needs to be replaced. The Replacement Scoring Report (RVS) is another report that RTA uses to calculate when a vehicle or equipment is due to be replaced. This report uses the APWA Standards to score for the 5 categories:
Projected Age (Life Expectancy)
Projected Mileage (Life Expectancy)
Maintenance Costs compared to Purchase Price of equipment
Service Count per year (WO lines or WO count)
Condition
Each of these categories can reach up to 5 points. The higher the number the more likely the vehicle needs replacement.
Class Codes (MVC)
You enter the parameters for the Replacement Scoring by Vehicle Class Codes.
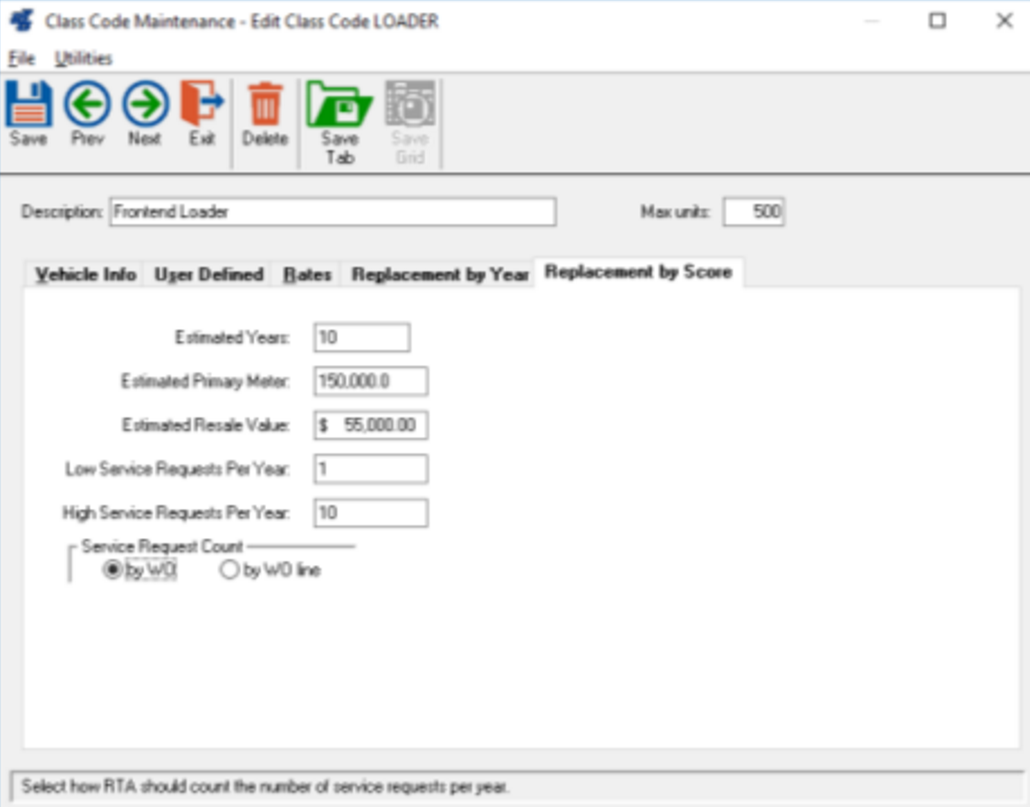
Select a Class Code (MVC) and under the “Replacement by Score” tab enter:
Estimated Years: Number of years to keep the vehicle before it should be replaced
Estimated Primary Meter: Number of units/miles before the vehicle should be replaced
Estimated Resale Value: What you realistically expect to recoup when you sell the vehicle.
Low Service Requests per Year: Minimum number of service requests (WO’s or WO Lines) for each vehicle per year.
High Service Requests per Year: Maximum number of service requests (WO’s or WO Lines) for each vehicle per year.
Service Request Count: Check the box to count WO’s or WO lines, in the calculations for the Low & High Service Requests per Year.
VMRS Codes (MRM)
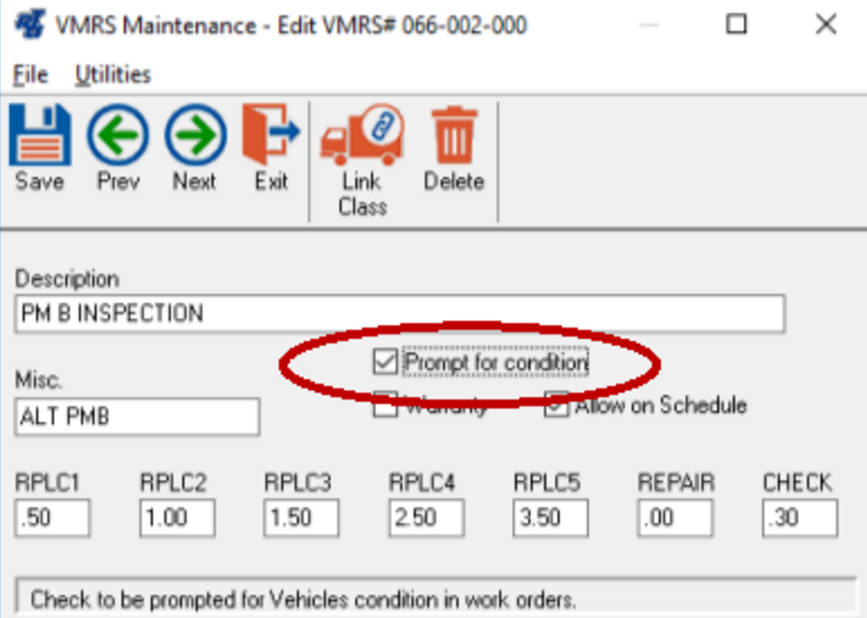
Prompt for Condition: You select which jobs you want the Mechanic to be prompted, to update the vehicles condition, when closing the WO line.
Check the box “Prompt for condition” of you want to be prompted for the Vehicle Condition.
This will also apply to mechanics closing the lines in Paperless Shop.
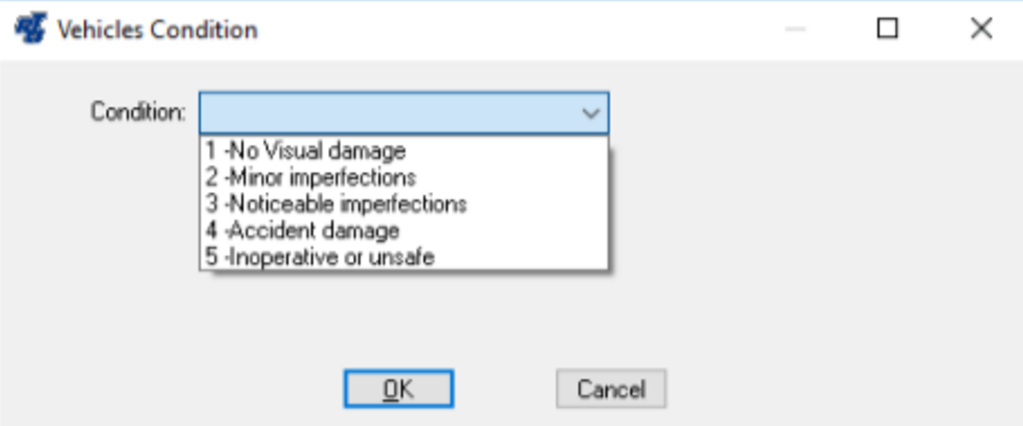
Example of prompt when closing the work order line.
Points
Points for Age, Mileage, Maintenance, and Service Counts are determined when they fall within the following percentages:
0% to 19% = 1 point
20% to 39% = 2 points
40% to 59% = 3 points
60% to 79% = 4 points
80% to 100+% = 5 points
Age Projection
Age Projection is the percentage of the vehicles current age divided by the Estimated Years. The Estimated Years is what you entered in the Class Code that the vehicle is assigned. The closer the vehicle’s current age is to the projected life, the higher the replacement number.
Example: The year is 2018, so a 2015 Vehicle is 3 years old (2018 – 2015 = 3). The class code’s Estimated Years is 10 years,
3 ÷ 10 = .30 or 30%. 30% is equal to 2 points.
Mileage/Kilometer/Hours Projection
(Mileage/Kilometers/Hour will be referred to as Units in this example).
The Units Projection is the percentage of the vehicle’s current Life Units divided by the Estimated Primary Units. The Estimated Primary Units is what you entered in the Class Code that the vehicle is assigned. The closer the vehicles current life units are to the Estimated Primary Units, the higher the replacement number.
Example: The vehicle’s life meter is 58,000 and the Estimated Primary Units is 150,000.
58,000 ÷ 150,000 = .387 or 38.7%. 38.7% is equal to 2 points.
Maintenance Costs Comparison
The Maintenance Cost Comparison is the vehicle’s maintenance cost (Parts, Labor, Outside Repairs from WO’s) divided by the vehicle’s purchase price.
Example: The vehicles maintenance cost is $6,359.00 and the purchase price was $52,000.00.
6,359.00 ÷ 52,000.00 = .122 or 12.2%. 12.2% is equal to 1 point.
Service Count Per Year
Is a calculation of: Subtract the number of WO’s (or WO lines) from the Min Service Count. Divide this by the sum of the Min and Max Service Count (that you entered in the Class Codes), to get the percentage.
Example: In the Class Code, under “Replacement by Score” tab, the Minimum Service Count is 1, the Maximum Service Count is 10, and the Vehicle’s WO count for the past year is 4 WO’s.
(# of WOs) 4 – (Min Cnt) 1 = 3, (Max Cnt) 10 - (Min Cnt) 1 = 9, 3 ÷ 9 = .33 or 33% 33% = 2 points.
Condition
Mechanical/Body Assessment is based on the condition you assess the vehicle to be (Enter 1 through 5).
For the condition you’ll want to consider inspections of the body condition, rust, interior condition, accident history, and future repairs. Lower numbers would indicate a good condition and high numbers would indicate a poor condition.
1 = Excellent condition - Interior and exterior no signs of wear, mechanically sound
2 = Vehicle better than average - Minimal wear inside and out, minor scratches dents, mechanically sound
3 = Average or normal wear and tear, with light cosmetic damage, mechanically sound)
4 = Excessive Wear and Tear - Dents & scratches, body damage, interior wear, engine or transmission not mechanically sound
5 = Severe Wear and Tear - May have collision damage, signs of severe abuse, engine or transmission in poor condition, although unit may be operable it’s near the end of its useful life)
Vehicle Replacement Scoring Report (RVS)
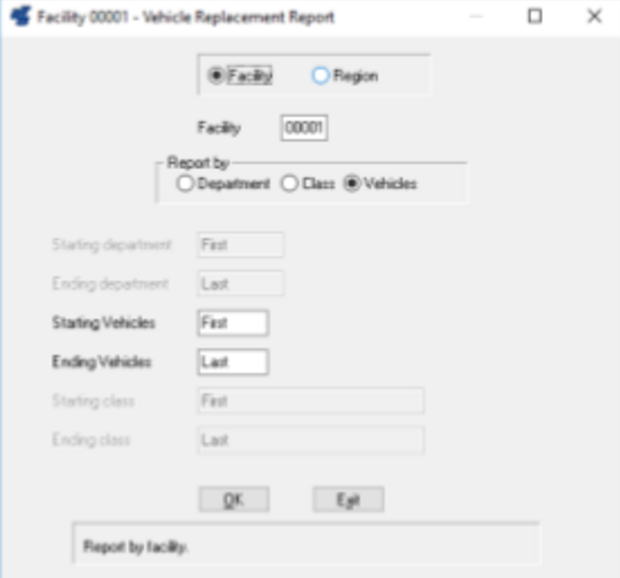
Prompts for Facility or Region Code
Prompts for Department, Class Code, or Vehicle range.
Click OK to run report.
The vehicle’s score points from these 5 areas explained above, are totaled to calculate the vehicle’s replacement score.
Score Points:
1-6 = Blue - Excellent
7-11 = Green - Good
12-18 = Yellow - Consider Replacement
19-25+ = Red - Needs Replacement


