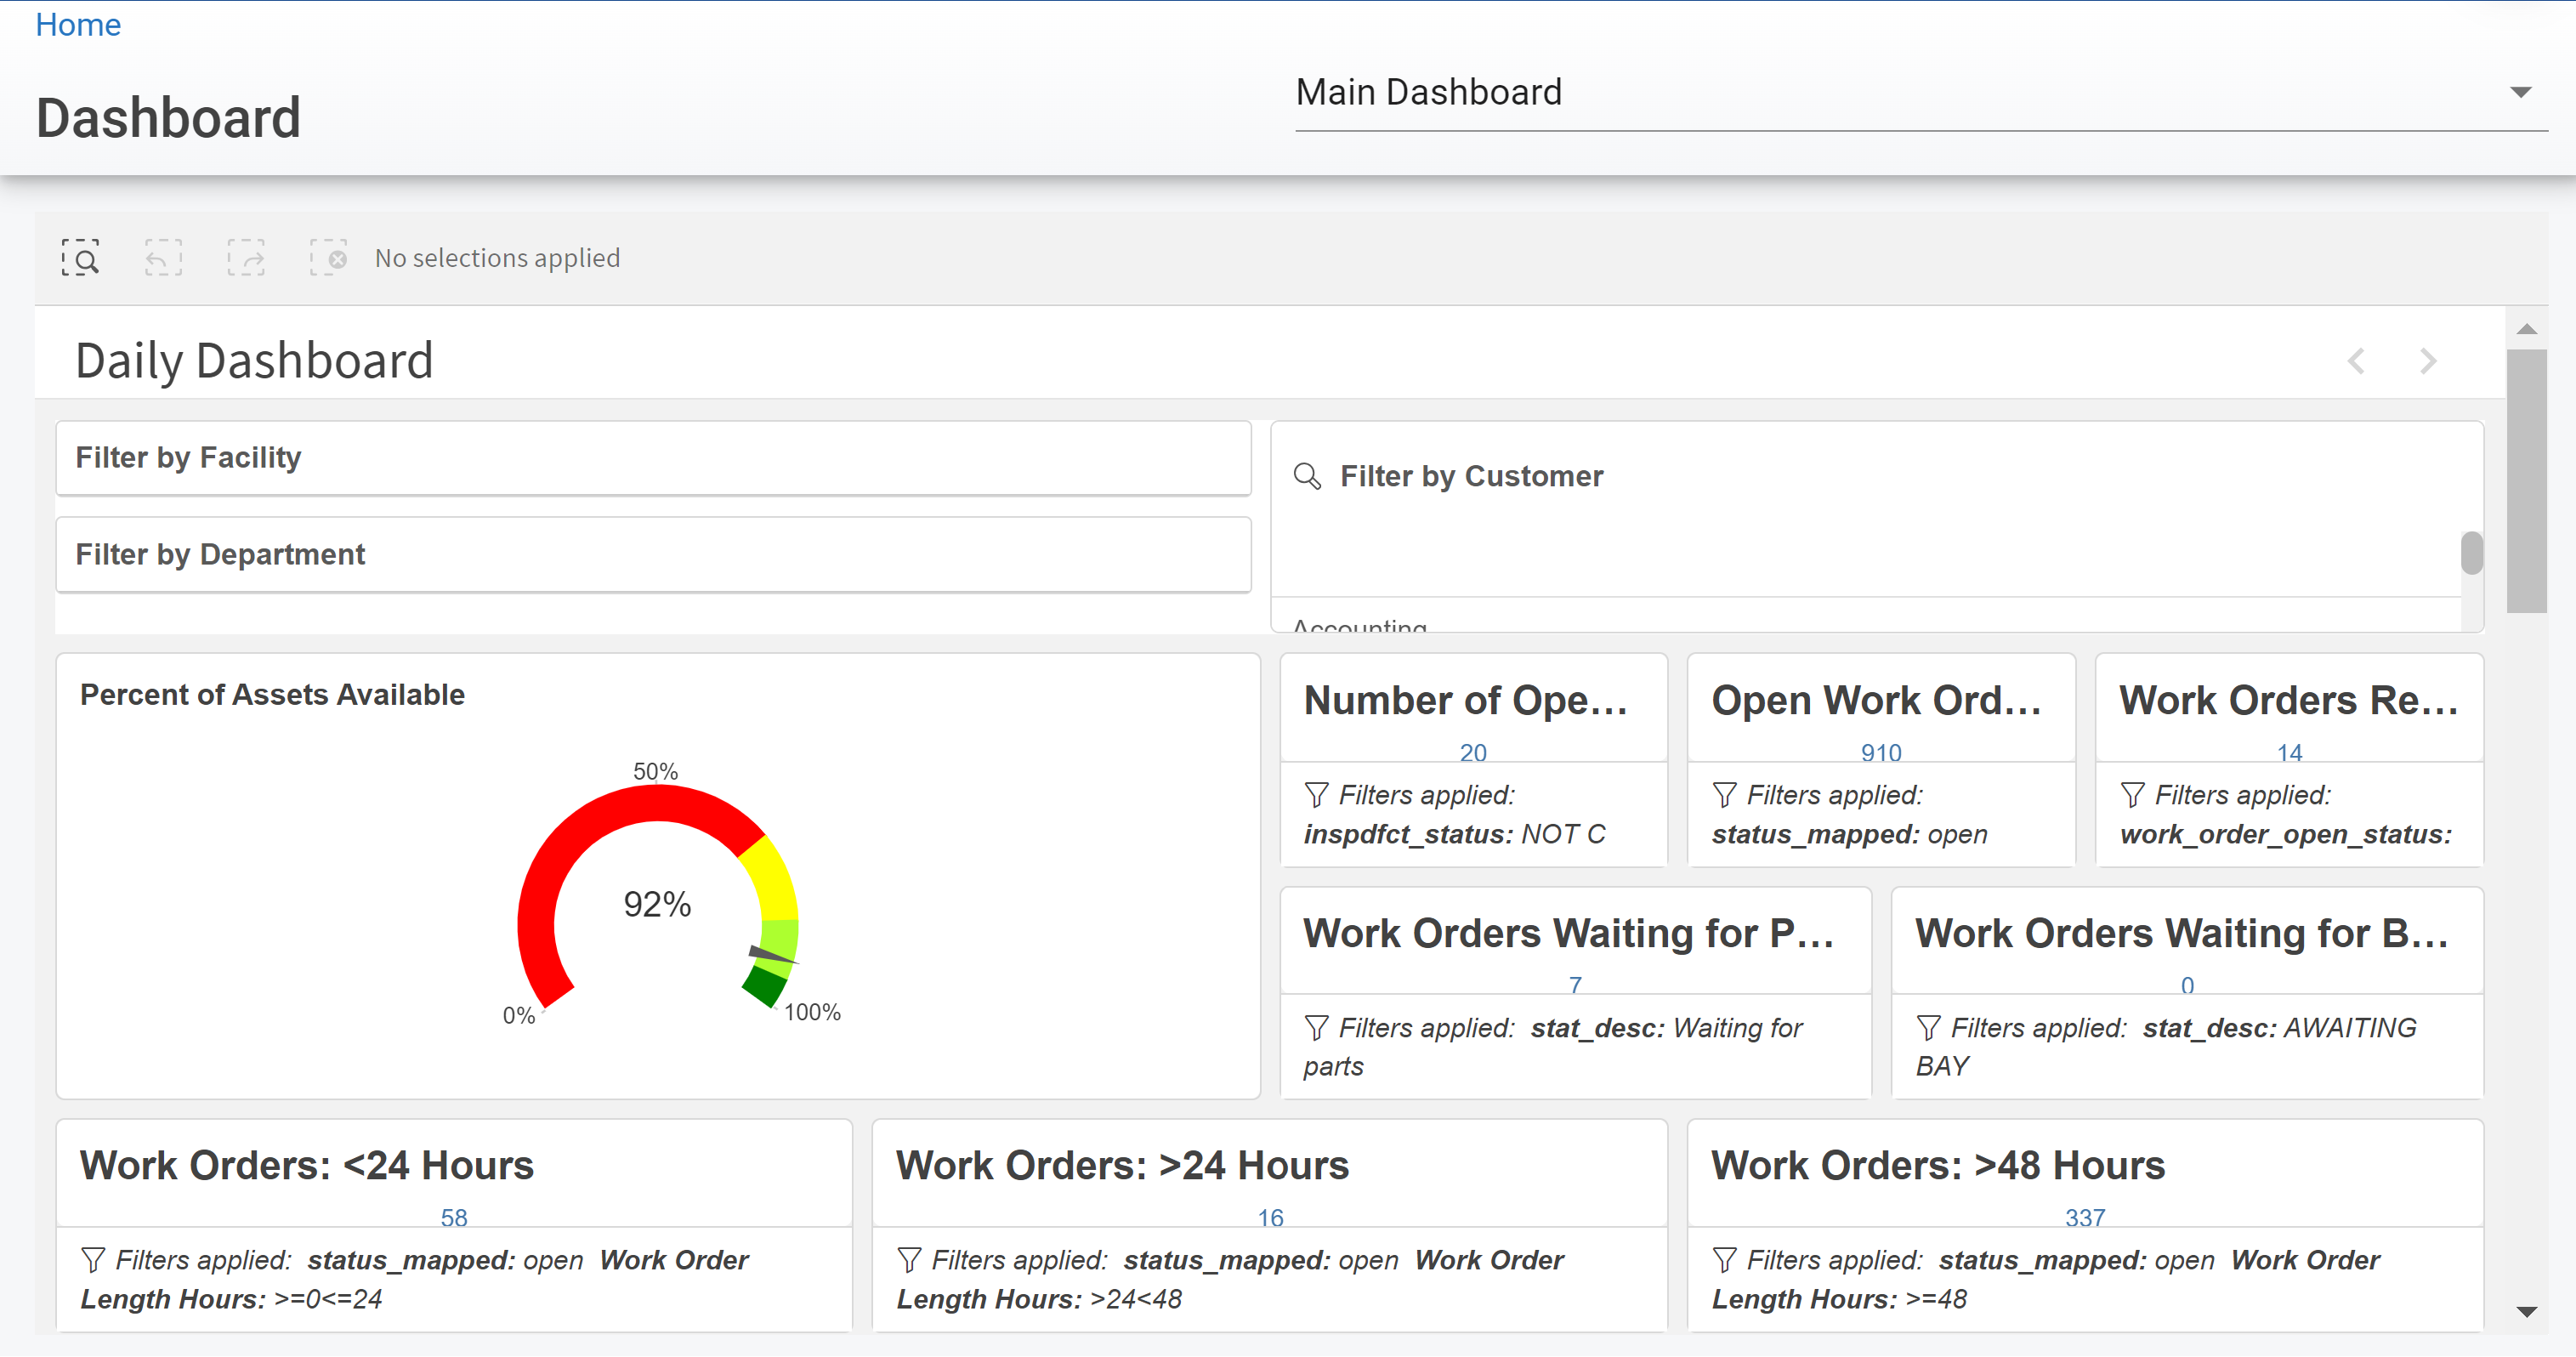
RTA Web - Dashboards - Main Dashboard
Main Dashboard: Daily Dashboard
Daily Dashboard |
|
|
|---|---|---|
Percent of Assets Available | Below 70% is red 70%-85% is yellow 85%-95% is light green Above 95% is dark green | Calculated based on vehicle status of available versus unavailable. |
Number of Open Defects |
| Number of defects from the Inspect app. |
Open Work Orders |
| Total number of work orders with an open status. |
Work Orders Ready for Review |
| Total number of work orders with a ready to review status. |
Work Orders Waiting for Parts |
| Total number of Work Orders with a Waiting on Parts Status |
Work Orders Waiting for Bay |
| Total number of Work Orders with a Waiting on Bay Status |
Work Orders Less than 24 hours |
| Work Orders open for less than 24 hours |
Work Orders Greater than 24 hours |
| Work orders open for longer than 24 hours but less than 48 hours. |
Work Orders Less than 48 hours |
| Work orders open for longer than 48 hours. |
Number of Assets Unavailable by Department |
| Number of assets in an unavailable status by department. |
Number of Assets Unavailable by Customer |
| Number of assets in an unavailable status by customer. |
Percent of Assets Available by Department |
| Percentage of assets with an available status by department. |
Percent of Assets Available by Customer |
| Percentage of assets with an available status by customer. |
Prior Year Completed PM Due Status | Green is on time/ Blue is past due | Previous year PM’s completed on time versus past due as a pie chart. |
Year to Date Completed PM Due Status | Green is on time/ Blue is past due | Current year to date PM’s completed on time versus past due as a pie chart. |
Month to Date Completed PM Due Status | Green is on time/ Blue is past due | Current month to date PM’s completed on time versus past due as a pie chart. |
Current Fuel Tank Values |
| Fuel Tank Inventory . |
Department Completed PM-On Time Status |
| PM’s completed on time by Department. Calculated for all time, but can be filtered by specific time ranges. |
Customer Completed PM-On Time Status |
| PM’s completed on time by Customer. Calculated for all time, but can be filtered by specific time ranges. |
Prior Year Average Work Order Length (Hours) |
| Previous year average work order open time in hours. |
Year to Date Average Work Order Length (Hours) |
| Current year to date average work order open time in hours. |
Month to Date Average Work Order Length (Hours) |
| Current month to date average work order open time in hours. |
