
RTA Web Dashboards
Dashboards and analytics are indispensible tools in the realm of data-driven decision making. They provide a comprehensive overview of critical information by visually representing data in a way that is easy to understand and interpret. Dashboards serve as a centralized hub, presenting key metrics, trends, and insights to empower fleet organizations to dig deeper into their data, uncover patterns, and extract actionable intelligence. In an increasingly complex and data rich industry, dashboards and analytics play a pivotal role in helping fleet leaders and organizations make informed decisions, optimize processes, and ultimately achieve their goals.
RTA Web Dashboards can be filtered by Facility, Department, Customer or Date Ranges. There are seven dashboards displaying a wide variety of data for you to make decisions.
Main Dashboard
Main Dashboard: Daily Dashboard
Leadership Dashboard
Strategic Dashboard: Asset Information
Strategic Dashboard: Maintenance and Repair
Strategic Dashboard: Carbon Emissions
Strategic Dashboard: Utilization by Class Code
Strategic Dashboard: Utilization by Department
Strategic Dashboard: Utilization by Customer
Main Dashboard
Main Dashboard: Daily Dashboard
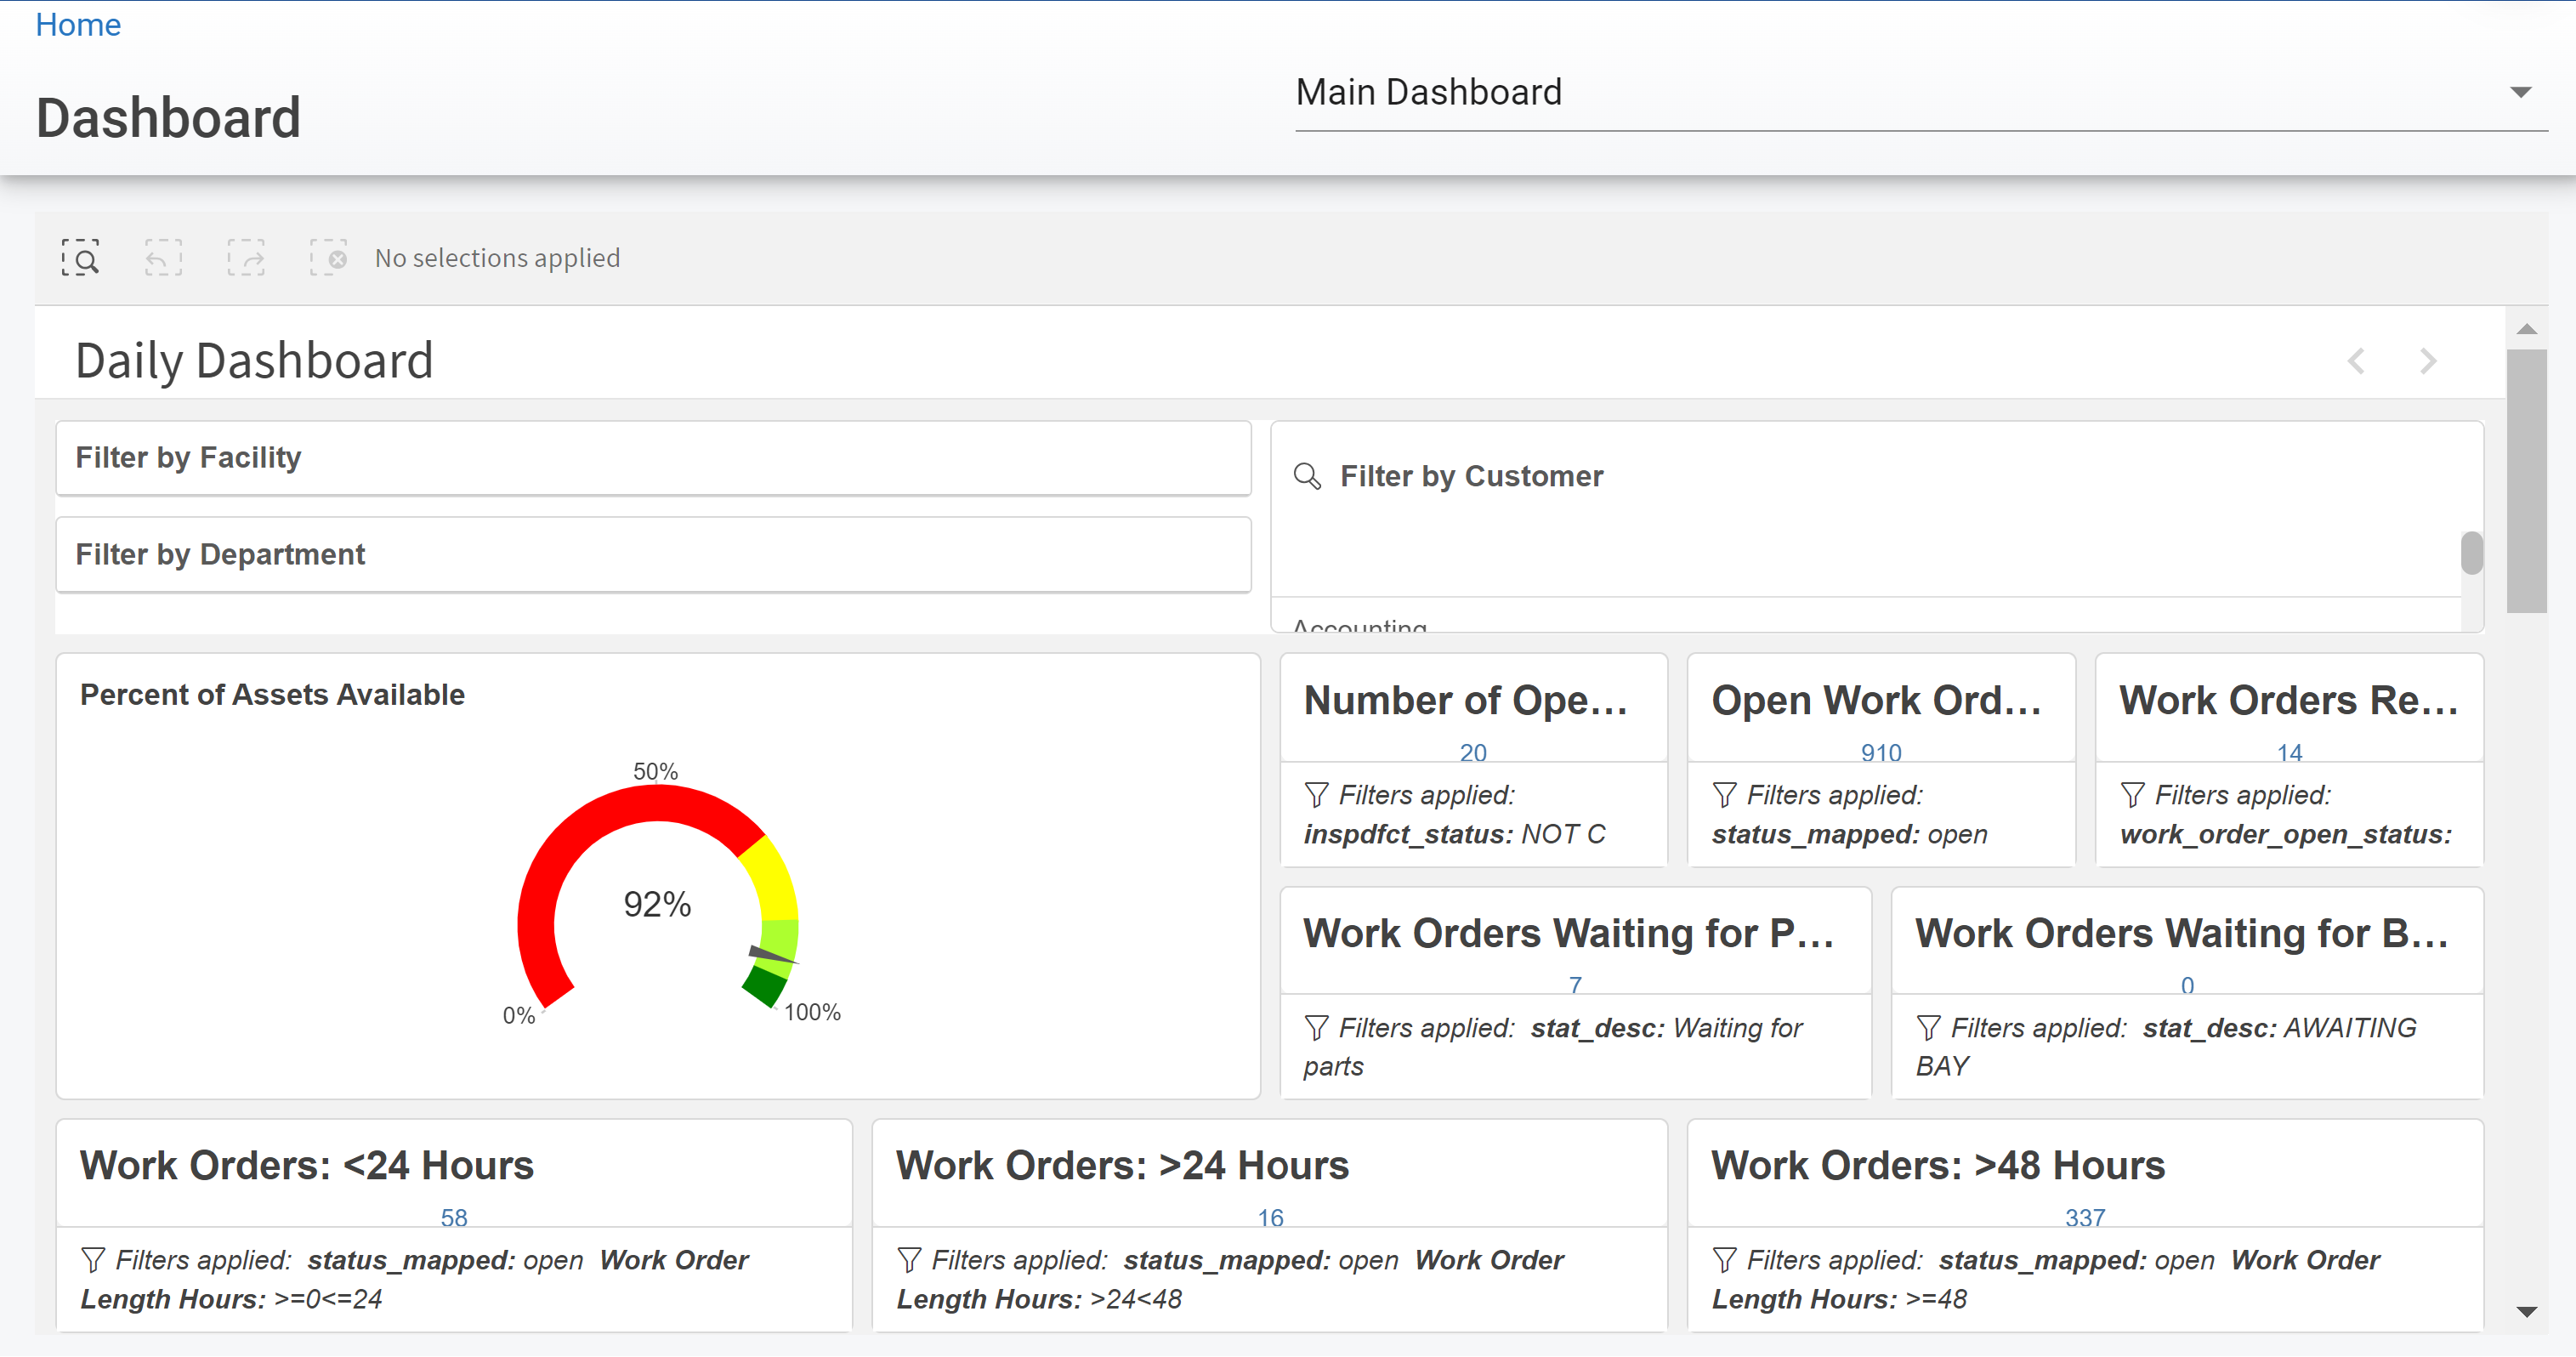
Daily Dashboard | ||
|---|---|---|
Percent of Assets Available | Below 70% is red 70%-85% is yellow 85%-95% is light green Above 95% is dark green | Calculated based on vehicle status of available versus unavailable. |
Number of Open Defects | Number of defects from the Inspect app. | |
Open Work Orders | Total number of work orders with an open status. | |
Work Orders Ready for Review | Total number of work orders with a ready to review status. | |
Work Orders Waiting for Parts | Total number of Work Orders with a Waiting on Parts Status | |
Work Orders Waiting for Bay | Total number of Work Orders with a Waiting on Bay Status | |
Work Orders Less than 24 hours | Work Orders open for less than 24 hours | |
Work Orders Greater than 24 hours | Work orders open for longer than 24 hours but less than 48 hours. | |
Work Orders Less than 48 hours | Work orders open for longer than 48 hours. | |
Number of Assets Unavailable by Department | Number of assets in an unavailable status by department. | |
Number of Assets Unavailable by Customer | Number of assets in an unavailable status by customer. | |
Percent of Assets Available by Department | Percentage of assets with an available status by department. | |
Percent of Assets Available by Customer | Percentage of assets with an available status by customer. | |
Prior Year Completed PM Due Status | Green is on time/ Blue is past due | Previous year PM’s completed on time versus past due as a pie chart. |
Year to Date Completed PM Due Status | Green is on time/ Blue is past due | Current year to date PM’s completed on time versus past due as a pie chart. |
Month to Date Completed PM Due Status | Green is on time/ Blue is past due | Current month to date PM’s completed on time versus past due as a pie chart. |
Current Fuel Tank Values | Fuel Tank Inventory . | |
Department Completed PM-On Time Status | PM’s completed on time by Department. Calculated for all time, but can be filtered by specific time ranges. | |
Customer Completed PM-On Time Status | PM’s completed on time by Customer. Calculated for all time, but can be filtered by specific time ranges. | |
Prior Year Average Work Order Length (Hours) | Previous year average work order open time in hours. | |
Year to Date Average Work Order Length (Hours) | Current year to date average work order open time in hours. | |
Month to Date Average Work Order Length (Hours) | Current month to date average work order open time in hours. |
Leadership Dashboard
Strategic Dashboard: Asset Information
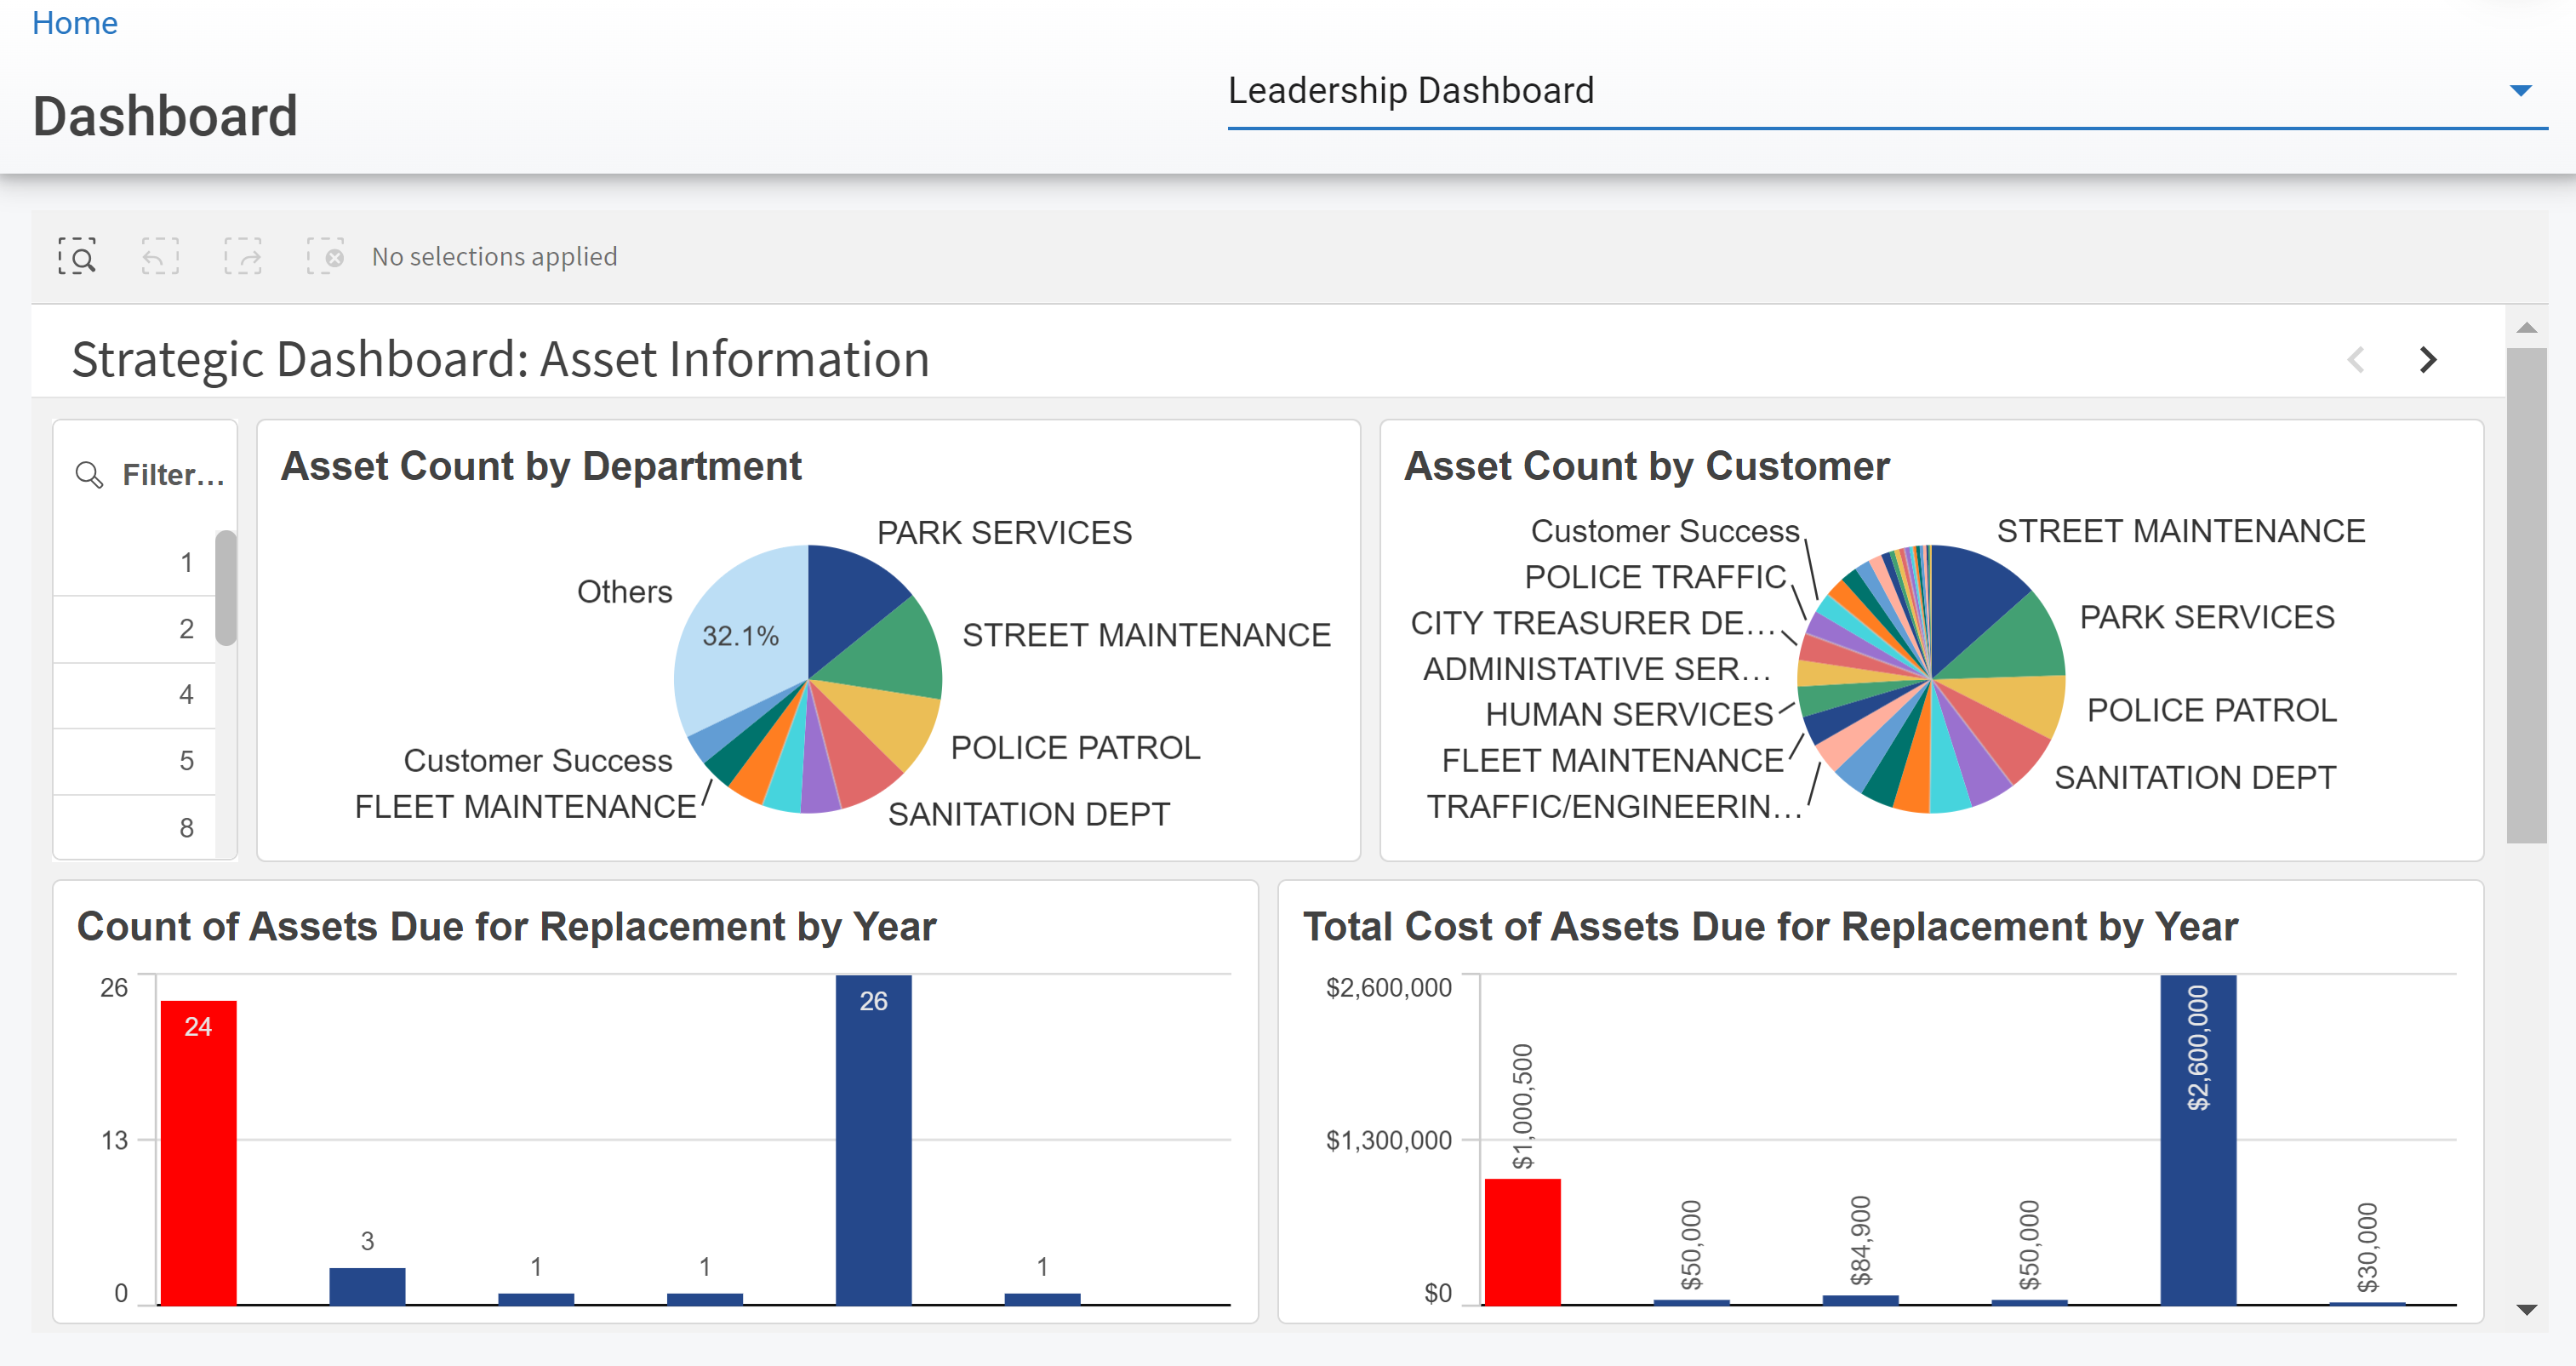
Strategic Dashboard: Asset Information | ||
|---|---|---|
Asset Count by Department | Total assets assigned to each department. | |
Asset Count by Customer | Total assets assigned to each customer. | |
Count of Asset Due for Replacement by Year | Red is overdue/ Blue is on time | Number of assets due for replacement by year. |
Total Cost of Asset Due for Replacement by Year | Red is overdue/ Blue is on time | Total cost of assets due by year. |
Average Percentage of Assets Available Monthly | Average overall percentage of assets with an available status by month. | |
Average Age of Assets by Class Code | Average age of assets by class code. | |
Average Age of Assets by Department | Average age of assets by department. | |
Average Age of Assets by Customer | Average age of assets by customer. |
Strategic Dashboard: Maintenance and Repair

Strategic Dashboard: Maintenance and Repair | ||
|---|---|---|
Average Hours to Resolution for Defects | Average time in hours to resolve defects from the inspect app. | |
Comeback Rate Year to Date | Comeback rate as a percentage year to date. | |
Total M&R Cost per Labor Hour Prior Year | Total maintenance and repair cost per labor hour for previous year. | |
Total M&R Cost per Labor Hour Year to Date | Total maintenance and repair cost per labor hour year to date. | |
Total M&R Cost per Labor Hour Month to Date | Total maintenance and repair cost per labor hour month to date. | |
Monthly M&R Cost by Department | Total monthly cost for maintenance and repair by department. | |
Monthly M&R Cost by Customer | Total monthly cost for maintenance and repair by customer. | |
Monthly Total Cost of Ownership by Department | Total monthly cost of ownership by department. | |
Monthly Total Cost of Ownership by Customer | Total monthly cost of ownership by customer. |
Strategic Dashboard: Carbon Emissions

Strategic Dashboard: Carbon Emissions | ||
|---|---|---|
Total Carbon Emission to Date | Calculated based on fuel use and type. | Carbon emissions to date. |
Total Carbon Emissions year over Year | Calculated based on fuel use and type. | Year over year comparison of carbon emissions. |
Strategic Dashboard: Utilization by Class Code (Primary and Alt Meters)

Strategic Dashboard: Utilization by Class Code | ||
|---|---|---|
Average Current Miles by Class Code | When primary or alternate meter is set to “Miles”. | Todays current average miles by class code. |
Average Annual Mileage by Class Code | When primary or alternate meter is set to “Miles”. | Calculated by dividing current odometer by age of asset. Then averaged by total assets assigned to the class code. |
Average Current Hours by Class Code | When primary or alternate meter is set to “Hours”. | Todays current average hours by class code. |
Average Annual Hours by Class Code | When primary or alternate meter is set to “Hours”. | Calculated by dividing current hours by age of asset. Then averaged by total assets assigned to the class code. |
Average Current Gallons by Class Code | When primary or alternate meter is set to “Gallons”. | Todays current average gallons by class code. |
Average Annual Gallons by Class Code | When primary or alternate meter is set to “Gallons”. | Calculated by dividing current gallons by age of asset. Then averaged by total assets assigned to the class code. |
Average Current Kilometers by Class Code | When primary or alternate meter is set to “Kilometers”. | Todays current average kilometers by class code. |
Average Annual Kilometers by Class Code | When primary or alternate meter is set to “Kilometers”. | Calculated by dividing current kilometers by age of asset. Then averaged by total assets assigned to the class code. |
Average Current KWpH (Kilowatts per Hour) by Class Code | When primary or alternate meter is set to “KWpH”. | Todays current average KWpH by class code. |
Average Annual KWpH (Kilowatts per Hour) by Class Code | When primary or alternate meter is set to “KWpH”. | Calculated by dividing current KWpH by age of asset. Then averaged by total assets assigned to the class code. |
Average Current Units by Customer | When primary or alternate meter is set to “Units”. | Todays current average units by class code. |
Average Annual Units by Class Code | When primary or alternate meter is set to “Units”. | Calculated by dividing current units by age of asset. Then averaged by total assets assigned to the class code. |
Average Current Days by Class Code | When primary or alternate meter is set to “Days”. | Todays current average days by class code. |
Average Annual Days by Class Code | When primary or alternate meter is set to “Days”. | Calculated by dividing current days by age of asset. Then averaged by total assets assigned to the class code. |
Average Current Tows by Class Code | When primary or alternate meter is set to “Tows”. | Todays current average tows by class code. |
Average Annual Tows by Class Code | When primary or alternate meter is set to “Tows”. | Calculated by dividing current tows by age of asset. Then averaged by total assets assigned to the class code. |
Strategic Dashboard: Utilization by Department (Primary and Alt Meters)

Strategic Dashboard: Utilization by Department | ||
|---|---|---|
Average Current Miles by Department | When primary or alternate meter is set to “Miles”. | Todays current average miles by department. |
Average Annual Mileage by Department | When primary or alternate meter is set to “Miles”. | Calculated by dividing current odometer by age of asset. Then averaged by total assets assigned to the department. |
Average Current Hours by Department | When primary or alternate meter is set to “Hours”. | Todays current average hours by department. |
Average Annual Hours by Department | When primary or alternate meter is set to “Hours”. | Calculated by dividing current hours by age of asset. Then averaged by total assets assigned to the department. |
Average Current Gallons by Department | When primary or alternate meter is set to “Gallons”. | Todays current average gallons by department. |
Average Annual Gallons by Department | When primary or alternate meter is set to “Gallons”. | Calculated by dividing current gallons by age of asset. Then averaged by total assets assigned to the department. |
Average Current Kilometers by Department | When primary or alternate meter is set to “Kilometers”. | Todays current average kilometers by department. |
Average Annual Kilometers by Department | When primary or alternate meter is set to “Kilometers”. | Calculated by dividing current kilometers by age of asset. Then averaged by total assets assigned to the department. |
Average Current KWpH (Kilowatts per Hour) by Department | When primary or alternate meter is set to “KWpH”. | Todays current average KWpH by department. |
Average Annual KWpH (Kilowatts per Hour) by Department | When primary or alternate meter is set to “KWpH”. | Calculated by dividing current KWpH by age of asset. Then averaged by total assets assigned to the department. |
Average Current Units by Department | When primary or alternate meter is set to “Units”. | Todays current average units by department. |
Average Annual Units by Department | When primary or alternate meter is set to “Units”. | Calculated by dividing current units by age of asset. Then averaged by total assets assigned to the department. |
Average Current Days by Department | When primary or alternate meter is set to “Days”. | Todays current average days by department. |
Average Annual Days by Department | When primary or alternate meter is set to “Days”. | Calculated by dividing current days by age of asset. Then averaged by total assets assigned to the department. |
Average Current Tows by Department | When primary or alternate meter is set to “Tows”. | Todays current average tows by department. |
Average Annual Tows by Department | When primary or alternate meter is set to “Tows”. | Calculated by dividing current tows by age of asset. Then averaged by total assets assigned to the department. |
Strategic Dashboard: Utilization by Customer (Primary and Alt Meters)

Strategic Dashboard: Utilization by Customer | ||
|---|---|---|
Average Current Miles by Customer | When primary or alternate meter is set to “Miles”. | Todays current average miles by customer. |
Average Annual Mileage by Customer | When primary or alternate meter is set to “Miles”. | Calculated by dividing current odometer by age of asset. Then averaged by total assets assigned to the customer. |
Average Current Hours by Customer | When primary or alternate meter is set to “Hours”. | Todays current average hours by customer. |
Average Annual Hours by Customer | When primary or alternate meter is set to “Hours”. | Calculated by dividing current hours by age of asset. Then averaged by total assets assigned to the customer. |
Average Current Gallons by Customer | When primary or alternate meter is set to “Gallons”. | Todays current average gallons by customer. |
Average Annual Gallons by Customer | When primary or alternate meter is set to “Gallons”. | Calculated by dividing current gallons by age of asset. Then averaged by total assets assigned to the customer. |
Average Current Kilometers by Customer | When primary or alternate meter is set to “Kilometers”. | Todays current average kilometers by customer. |
Average Annual Kilometers by Customer | When primary or alternate meter is set to “Kilometers”. | Calculated by dividing current kilometers by age of asset. Then averaged by total assets assigned to the customer. |
Average Current KWpH (Kilowatts per Hour) by Customer | When primary or alternate meter is set to “KWpH”. | Todays current average KWpH by customer. |
Average Annual KWpH (Kilowatts per Hour) by Customer | When primary or alternate meter is set to “KWpH”. | Calculated by dividing current KWpH by age of asset. Then averaged by total assets assigned to the customer. |
Average Current Units by Customer | When primary or alternate meter is set to “Units”. | Todays current average units by customer. |
Average Annual Units by Customer | When primary or alternate meter is set to “Units”. | Calculated by dividing current units by age of asset. Then averaged by total assets assigned to the customer. |
Average Current Days by Customer | When primary or alternate meter is set to “Days”. | Todays current average days by customer. |
Average Annual Days by Customer | When primary or alternate meter is set to “Days”. | Calculated by dividing current days by age of asset. Then averaged by total assets assigned to the customer. |
Average Current Tows by Customer | When primary or alternate meter is set to “Tows”. | Todays current average tows by customer. |
Average Annual Tows by Customer | When primary or alternate meter is set to “Tows”. | Calculated by dividing current tows by age of asset. Then averaged by total assets assigned to the customer. |