Grouping Basics
Understanding Groups
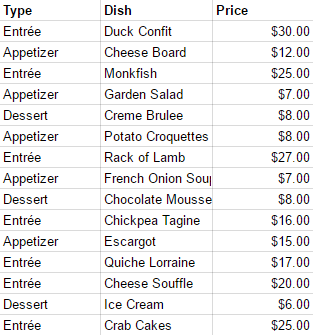
Groups break up a data set into sections of related information, allowing for aggregation and/or the removal of repeated values from the tabular detail. We see grouping in lots of settings, but restaurant menus provide a useful example. We never see menus like this:
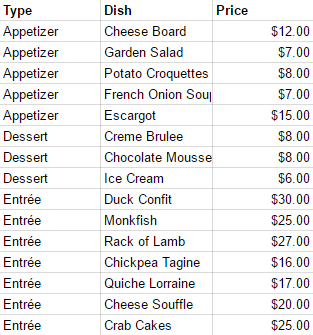
Or like this:
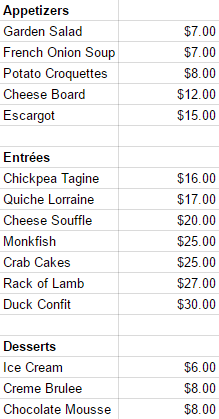
In the above example, the menu is stored by dish type, but there are repeated values in the "Type" column, which makes the menu difficult to read at a glance. For this reason, menus typically group on dish type:
Grouping works a bit differently in the application, but its function is the same. In either case, the first step in creating a group is sorting on the appropriate data field.
Creating Sorts
Users may either build sorts from the report Wizard or from the report Designer.
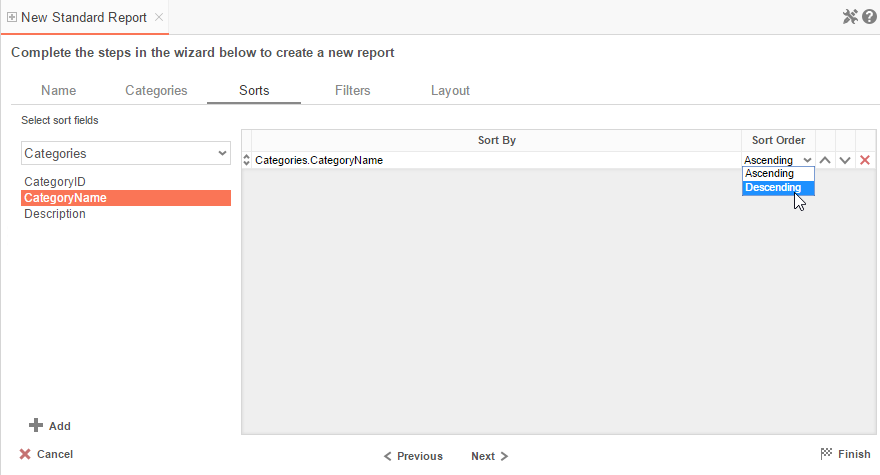
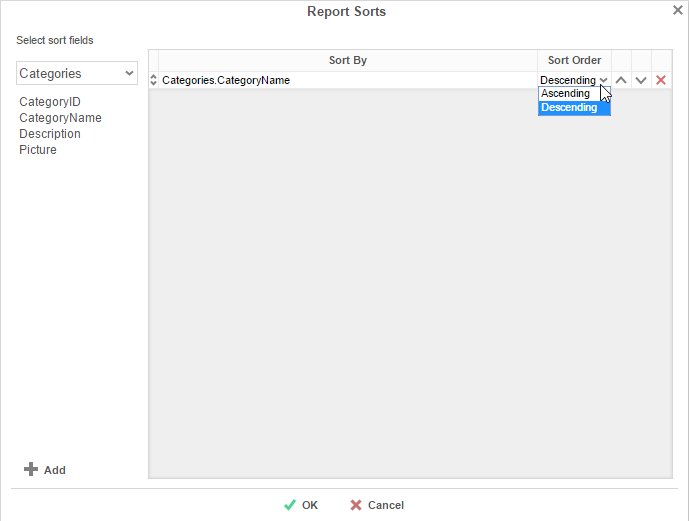
The Sorts Tab is the third tab in the report Wizard. To create a sort, drag and drop a data field into the sorts pane. Select "Ascending" or "Descending" from the Sort Order drop-down menu. Add as many sorts as you like, and change sort priority by using the up () and down () arrows.
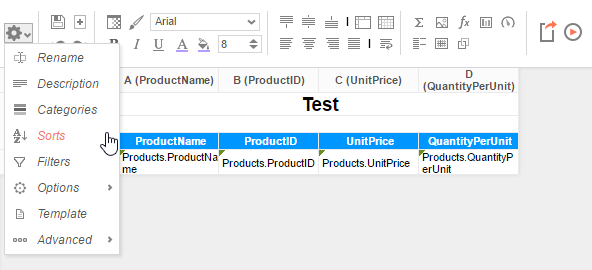
Once in the report Designer, users may adjust their Sorts from the settings menu ().
The Designer Sorts menu functions much the same as the Wizard Sorts menu does.
Once you've sorted on a field, you're ready to group on that field.
NOTE. Nested groups should reflect the sort order. The outermost group header should be the highest priority sort, and the footer order should be reversed. Find more information on this Understanding Sorting and Grouping.
Sorting By Formula
To sort and group by information that may not be contained within an individual data field, you can use Formulas. See What are formulas for additional help.
Pressing the button or the Formula Editor () button opens the Formula Editor window:
- Add a Data Field by dragging and dropping it into the 'Formula' box or double-clicking it. Or enter it manually using the following format: {DataCategory.DataField}.
- Add a Parameter by entering it manually using the following format: @ParameterName@.
- Add a function by dragging and dropping it into the 'Formula' box or double-clicking it. Or enter it manually.
For example, say I had a data field containing a full date and time, and I wanted to analyze my sales by each month of the year over a multi-year period.
I could use the formula Month({Orders.OrderDate}) to return only the Month component of each date. Then I could sort my sales by Month.
Adding Group Sections
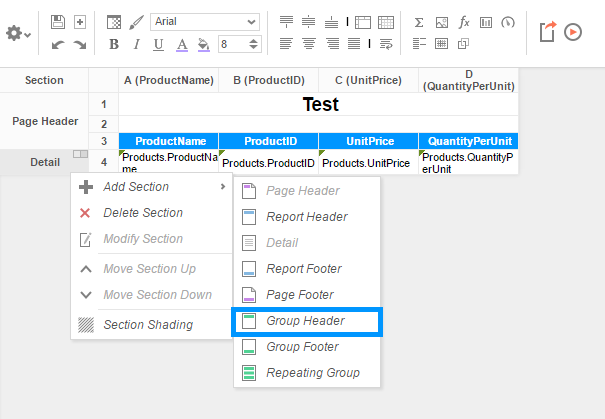
In order to add the group sections, click anywhere in the sections tab in the report designer. From here, select Add Section and then add Group Header.
In the Group Header Menu, use the drop down to select the proper sort field. For this report, Categories.Category Name has been selected.
NOTE. Groups can be sorted by formula instead of a Category or Field by adding a formula to the report Sorts, then selecting it in the group dropdown menu.
After adding the Group Header, repeat the same steps above to create a group footer by selecting Group Footer from the menu.
Group Header and Footer Content
Headers and Footers are designed to display content that will appear once per unique value in the group. Group Headers appear above the group detail, and Group Footers appear below the group detail.
(pre-v2019.1.4) Group Footers may be used to perform aggregate functions on the group detail.
(v2019.1.4+) Group Headers and Footers may be used to perform aggregate functions on the group detail.
In this example, there is a group header on Categories.CategoryName, and there are three rows in that header. The first row is to create space between groups. The second contains the Categories.CategoryName field, which will repeat once for each unique Category Name in the Categories object. The third contains column titles for the details section. They will also appear once for each unique Category Name in the Categories object.
In the footer section, we are taking the average of the products' unit prices in each category. This function, like the values in the Group Header, will appear once for each Category Name in the Categories data object.
NOTE. Because headers are not designed for content that will produce many different results for each group, it is best to select content that will only change with each group. For example, if OrderDetails.Quantity is placed in a group header, it will only display the first record for each group break. Additionally, placing this field in a group footer will display only the last record in the group.
Upon execution, the report now shows breaks for each food category name and displays aggregate information for the unit prices in each category.
The next step in understanding the basics of report building is to gain an understanding of Formulas. See Formula Basics next.
Reprinting Group Headers
Beginning in version 2018.2, you have the option to reprint Group Header rows at the top of the page if the detail section of any given group spans multiple pages. This option is only available on Group and Repeating Group Header sections. To reprint a Group Header row when its detail section continues onto another page, click the row number in the Report Designer and select Repeat Row. If the Header has been set to repeat, two blue lines will display next to the row number.
